Hi friends;
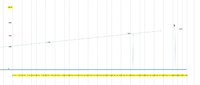
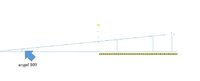
I have a question that I couldn’t solve it. I’m interested in stock markets and I want to guess price trend. Please look at the image 1. Highest prices, on Day 9 price was 1290 and 1685 for Day 26. When I draw a line using these two points on the graph paper towards 0 line, I had a line with 109 degree angle. So the question are;
In order to understand, if it is possible or not to do it. I used real numbers on the graph paper. And I got the price 1829 for Day 35. So I checked it out on the computer looking the stock market datas. I saw that market data and my calculation on the graph paper are same.
Due to there are lots of item in the stock markets It is impossible to do this. If you give some information I want to use it in Excel to calculate.
Thanks a lot for your help.
I have a question that I couldn’t solve it. I’m interested in stock markets and I want to guess price trend. Please look at the image 1. Highest prices, on Day 9 price was 1290 and 1685 for Day 26. When I draw a line using these two points on the graph paper towards 0 line, I had a line with 109 degree angle. So the question are;
- If I draw this line to the future days, what will be the points value? For example; for Day 29 or 35.
- How can I calculate the angle using these values? (point 1 and 2 and day number)
In order to understand, if it is possible or not to do it. I used real numbers on the graph paper. And I got the price 1829 for Day 35. So I checked it out on the computer looking the stock market datas. I saw that market data and my calculation on the graph paper are same.
Due to there are lots of item in the stock markets It is impossible to do this. If you give some information I want to use it in Excel to calculate.
Thanks a lot for your help.