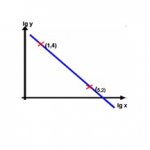
Okay. Log-base-10. So, the graph is not the standard x-y-coordinate system. It is a log(x)-log(y)- coordinates system.
Those numbers are ordered (x, y) pairs (i.e., the coordinates of points). The axis labels show what those numbers represent.
(1, 4) and (5, 2)
[From the image, I can't tell whether it's a 5 or a 6.]
When x is 1, it means log(x) = 1. So, what number is x?
When y is 4, it means log(y) = 4. So, what number is y?
These numbers give new coordinates for the point, in the xy-coordinate system: (10, 10000) .
Convert the coordinates (5, 2) into (x, y) coordinates the same way.
Then you'll have coordinates for two points in the new system. Find the equation of y in terms of x the usual way (i.e., slope formula and point-slope formula).