eddy2017
Elite Member
- Joined
- Oct 27, 2017
- Messages
- 2,525
hi there dear tutors:
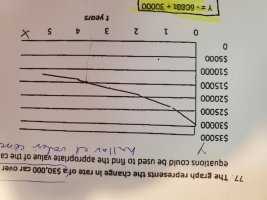
the graph represents the change in rate of a $30,000 car over 5 years. Which of the following equations could be used to find the appropriate value of the car after t years when 0 ≤ t ≤5 ?
i have to choose the right answer
the equation given as correct is y= -6000t + 30000
but there’s no explanation whatsoever of what steps or strategy led to the solution and i don't have the slightest idea about how to begin this.
Can you help, and please tell me if there is any video that I can watch dealing with this type of problems.
so appreciative of your help like always!
i think i have not told you my teachers on the forum, but i am not attending a regular school. i have finished my bachelor except for math that i took as a separate subject cos i struggle there.
perhaps you're wondering why i don't ask my teachers or why i do not refer to my textbook. i think you should know this. I'm prepping on my own with your help only and videos and sites on the www.