The city of New Orleans is located at latitude 30°N.

kafkareich

New member
Joined
Jan 16, 2016
Messages
2
The city of New Orleans is located at latitude 30°N.

The city of New Orleans is located at latitude 30°N. Use the figure below to find a function that models the number of hours of daylight at New Orleans as a function of the time of year. To check the accuracy of your model, use the fact that on March 31 (t = 90) the sun rises at 5:51 AM and sets at 6:18 PM in New Orleans.

Function: L(t)=
attachment.php
 

Attachments

  • Screen Shot 2016-01-16 at 2.15.08 AM.jpg
    Screen Shot 2016-01-16 at 2.15.08 AM.jpg
    19.4 KB · Views: 52
The city of New Orleans is located at latitude 30°N. Use the figure below to find a function that models the number of hours of daylight at New Orleans as a function of the time of year. To check the accuracy of your model, use the fact that on March 31 (t = 90) the sun rises at 5:51 AM and sets at 6:18 PM in New Orleans.

Function: L(t)=
attachment.php
What are your thoughts?

Please share your work with us ...even if you know it is wrong

If you are stuck at the beginning tell us and we'll start with the definitions.

You need to read the rules of this forum. Please read the post titled "
Read before Posting" at the following URL:

http://www.freemathhelp.com/forum/th...Before-Posting
 
The city of New Orleans is located at latitude 30°N. Use the figure below to find a function that models the number of hours of daylight at New Orleans as a function of the time of year.
Are you supposed to guess what the values for "Hours" are, or have they given you tabular information?

When you reply, please include a clear listing of your thoughts and efforts so far, starting with how you think you are supposed to bring the techniques of calculus to bear. Thank you! ;)
 
Are you supposed to guess what the values for "Hours" are, or have they given you tabular information?

When you reply, please include a clear listing of your thoughts and efforts so far, starting with how you think you are supposed to bring the techniques of calculus to bear. Thank you! ;)

Hi! Actually this is the entire data available in the problem. I have troubles interpreting what the problem really is asking for..
 
Actually this is the entire data available in the problem. I have troubles interpreting what the problem really is asking for..
It's asking you to do the same sinusoidal modelling you did back in trigonometry (here). (At least, I'm not seeing any way to apply anything from calculus to this.) So see how far you can get by using what you learned back then.

If you get stuck, please reply with a clear listing of your thoughts and efforts so far. Thank you! ;)
 
The city of New Orleans is located at latitude 30°N. Use the figure below to find a function that models the number of hours of daylight at New Orleans as a function of the time of year. To check the accuracy of your model, use the fact that on March 31 (t = 90) the sun rises at 5:51 AM and sets at 6:18 PM in New Orleans.

Function: L(t)=
attachment.php
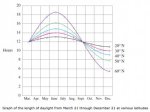
As an example, let's restrict our discussion for the 60\(\displaystyle ^\circ\)N curve.

First, you are expected to measure time in days [see the t=90 for March 31st]. Next this looks like a periodic function. That is each individual function is the same each year starting at equal day and night hours on March 21st [assuming they are using the usual approximate time of the spring equinox]. Then, skipping leap years, L(t+365)=L(t). From the graph, L(t) looks like an offset sine function. The amplitude is 6.5 [from a midpoint of 12 to a maximum of about 18.5], the offset is 12 [from the 12 midpoint], and the period is 365. So, arbitrarily starting the daytime [sunrise] period at 6am on March 21 [t=80.25] with longer hours of daylight being earlier and the time being split evenly on the am and pm side, we will take
L(t) = 12 + 6.5 sin(\(\displaystyle \frac{2\, \pi\, (t\, -\, 80.25)}{365}\))

We then have sunrise SR (hours in 24 hour clock notation)
SR(t) = 6 - 0.5 [L(t) - 12] = 6 - 3.25 sin(\(\displaystyle \frac{2\, \pi\, (t\, -\, 80.25)}{365}\))
and sunset SS as
SS(t) = 18 + 0.5 [L(t) - 12] = 18 + 3.25 sin(\(\displaystyle \frac{2\, \pi\, (t\, -\, 80.25)}{365}\))
Using the summer solstice of approximately June 21 (t=172) as the minimum sun rise and maximum sunset times we get
SR(172) ~ 6 - 3.25 sin(0.50274 \(\displaystyle \pi\)) ~ 2.75 = 2:45 am
SS(172) ~21.25 = 9:15 pm
which agrees pretty well with the graph, i.e. daylight hours of about 18.5 hours.

For the winter solstice of about Dec 21 [t=355] we have
SR(355) ~ 6 - 3.25 sin(1.50548 \(\displaystyle \pi\)) ~ 9.25 = 9:15 am
SS(172) ~14.75 = 14:55 pm
or about 5.5 hours of daylight which agrees pretty well with the graph.
 
Top