DonaldMurray1
New member
- Joined
- Mar 12, 2018
- Messages
- 1
I need help with the last page, I have been trying to do it for my spring break, but I just don't get it.
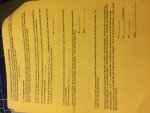
A temperature probe is placed in a cup of hot water. It remains there for approximately 35 seconds; then it is removed from this cup and placed in a cup of cool water for another 35 seconds. The objective of this activity is to find an algebraic function that models the temperature recorded by the probe over the entire 70 seconds, and then apply some calculus concepts to the function.
1. [A review of piecewise functions, not included here.]
Complete the chart below from the data that was collected from the experiment. The data appears to have horizontal asymptotes at y = 173 and y = 41.
2. Create a scatterplot in your calculator. [Not included here.]
3. The General Solution (Newton's Law of Cooling/Heating)
We want to find a function F(t) that models the Fahrenheit temperature F of the probe at any time t, measured in seconds. Using a property of physics called Newton's Law of Cooling/Heating, the temperature in an activity such as this can be modeled by an exponential function in the form:
. . .F(t) = a bt + c
4. The Specific Solution
First, to find an algebraic function that models our temperature-versus-time data, it is clear that we need to write a piecewise function, one rule for the first (approximately) 35 seconds and another for the last (approximately) 35 seconds. To find both of these rules, we will use the property of Newton's Law of Cooling.
In order to find a model of the form F(t) = a bt + c for the first part of our data, we need to find the constants a, b, and c. We can find the constants a and c from the chart above, or by "tracing" on our scatterplot.
First, we need to find the constant c. According to Newton's Law of Cooling/Heating, and the data collected, the value of c would be approximately:
. . .c = ____________
To find a, record the temperature when t = 0: (0, _86.9_) Substitute this ordered pair, with the value of c, into our model F(t) = a bt + c, and solve for a.
. . .a = ____________
To find b, the last constant in the model, we need another ordered pair. Let's use the ordered pair from the chart when t = 10. Record the ordered pair: (10, ________)
Substitute these values into the equation (with the values of a and c), and solve for the last unknown constant b. Round b to three decimal places.
. . .b = ____________
. . .F(t) = ____________
To check your work, graph your equation with your scatterplot to see how it fits the first part of the data.
The equation that fits the second part of the data is similar to the first equation. However, since we are beginning with a time other than t = 0, we need to apply a "horizontal shift" to our function. Therefore, the resulting form of this function is:
. . .F(t) = a bt-h + c
where h = 35. Use this form, and the hints given for the first part of the function, and find a rule that fits this part of the scatterplot. Again, graph this equation to check it.
. . .a = ____________
. . .b = ____________
. . .c = ____________
. . .F(t) = ____________
A temperature probe is placed in a cup of hot water. It remains there for approximately 35 seconds; then it is removed from this cup and placed in a cup of cool water for another 35 seconds. The objective of this activity is to find an algebraic function that models the temperature recorded by the probe over the entire 70 seconds, and then apply some calculus concepts to the function.
1. [A review of piecewise functions, not included here.]
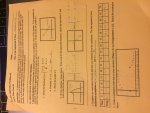
Complete the chart below from the data that was collected from the experiment. The data appears to have horizontal asymptotes at y = 173 and y = 41.
| Time | 0 | 5 | 10 | 15 | 20 | 25 | 30 | 35 | 40 | 45 | 50 | 55 | 60 | 65 | 70 |
| Temp | 86.9 | 150.9 | 165.6 | 170.3 | 172.0 | 172.3 | 172.5 | 172.6 | 85.9 | 59.1 | 48.6 | 44.8 | 43.1 | 42.3 | 41.7 |
2. Create a scatterplot in your calculator. [Not included here.]
3. The General Solution (Newton's Law of Cooling/Heating)
We want to find a function F(t) that models the Fahrenheit temperature F of the probe at any time t, measured in seconds. Using a property of physics called Newton's Law of Cooling/Heating, the temperature in an activity such as this can be modeled by an exponential function in the form:
. . .F(t) = a bt + c
4. The Specific Solution
First, to find an algebraic function that models our temperature-versus-time data, it is clear that we need to write a piecewise function, one rule for the first (approximately) 35 seconds and another for the last (approximately) 35 seconds. To find both of these rules, we will use the property of Newton's Law of Cooling.
In order to find a model of the form F(t) = a bt + c for the first part of our data, we need to find the constants a, b, and c. We can find the constants a and c from the chart above, or by "tracing" on our scatterplot.
First, we need to find the constant c. According to Newton's Law of Cooling/Heating, and the data collected, the value of c would be approximately:
. . .c = ____________
To find a, record the temperature when t = 0: (0, _86.9_) Substitute this ordered pair, with the value of c, into our model F(t) = a bt + c, and solve for a.
. . .a = ____________
To find b, the last constant in the model, we need another ordered pair. Let's use the ordered pair from the chart when t = 10. Record the ordered pair: (10, ________)
Substitute these values into the equation (with the values of a and c), and solve for the last unknown constant b. Round b to three decimal places.
. . .b = ____________
. . .F(t) = ____________
To check your work, graph your equation with your scatterplot to see how it fits the first part of the data.
The equation that fits the second part of the data is similar to the first equation. However, since we are beginning with a time other than t = 0, we need to apply a "horizontal shift" to our function. Therefore, the resulting form of this function is:
. . .F(t) = a bt-h + c
where h = 35. Use this form, and the hints given for the first part of the function, and find a rule that fits this part of the scatterplot. Again, graph this equation to check it.
. . .a = ____________
. . .b = ____________
. . .c = ____________
. . .F(t) = ____________
Attachments
Last edited by a moderator:
")