Let me step you through it.
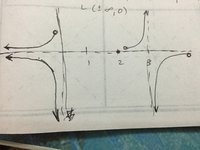
1. f(2) = 0 means (2, 0) is on the graph. Good you've got that.
View attachment 12890
2. Notice that moving from the left towards 3,the graph gets infinitely high.
Moving from the right towards 3, the graph gets infinitely low.
This suggests that there might be an asymptote at x=3.
So you've drawn the graph correctly near x=3. Good.
3.
View attachment 12891
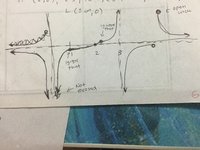
This means that coming in to 0 from the left AND the right the graph goes down to negative infinity.
So to the left of 0 you have it correct but I see you have crossed out the bit coming in from the right!
4.
View attachment 12892
This means that at the far right of your graph and the far left of your graph the graph approaches the x-axis.
On the right you are correct. And on the left
below the x-axis you are correct.
Now get rid of the bit above the x-axis on the left. That's incorrect (as Halls said it is a function after all).
Now for the bit between 0 and 3 Your arrow at the bottom left of this section is correct (the one you crossed out!).
The arrow at the top right of this section is also correct as is the point (2, 0). So now join the bottom arrow through the point (2, 0) to the top arrow.
There will be some sort of inflection point along the way but you are not given enough info to locate it. (That's why the question says graph
a function not graph
the function.)


") ?
?