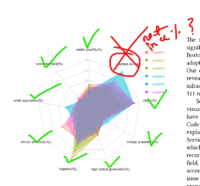
Hi Yeah I know of that Excel function. Thank you for clarification. I am working with a teacher who wants something like that polar chart in the attachment. I have told her that previous calculation which were done to find those median percentage values are NOT correct. She wants me to do same thing. That's why I am so baffled by it, and asking everywhere how to get it. Frankly I have never seen them in a percentage form.
Her instruction was she needs them in percentage form so she can compare each tracts in the polar chart. And the dataset was given to me, which is in my question. That's all.
First, clearly you didn't mean to ask for a percentile.
Second, it would not be appropriate to give the percent of the total of all median incomes, or of the median of medians.
But for this kind of chart, what you really want is just something proportional to the given data, and
pretending to be a percentage value. The goal is merely to compare, so exactly what it is doesn't matter so much.
Each other number in the chart is a percentage, not of something pertaining to the
whole, but of that
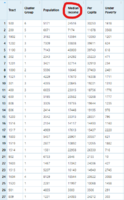
individual population: what percentage of the residents of a cluster are white, or unemployed, or whatever. Median income is not like that; it isn't, say, the percent of people who are rich. But for your purposes it will probably be good enough just to produce a number between 0 and 100 (really 0 and 1) that is proportional to the median income of the cluster.
So I would just divide each median income by the
largest of them, so that the richest would score 100%. (If you did this relative to the median of medians, then half the numbers would be greater than 100%, which is illegal on such a chart.) This in effect pretends that the income of the richest is the goal for all: "my neighborhood is 80% rich, yours is only 35% rich".
Since no other category ever reaches 100%, you might want to scale that down; you could just arbitrary halve each percent you get to the highest is 50%, or take it relative to the highest median income of any neighborhood in the country.
In any case, it won't really be the same type of value as the others, but it may be a sufficiently reasonable fake.
 I just needed to change each median income in there percent form.