Stu_Souten
New member
- Joined
- Nov 11, 2018
- Messages
- 6
Hello all
I was hoping someone could help me with the following.
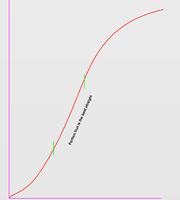
I have a plot of data that looks like an S.
I want to find 2 x points on the plot that resembles a straight and obtain those co-ordinates.
Attached is a picture of a plot which shaped as an S.
I have found the portion of the straight and marked them in green.
I wish to know the co-ordinates of these points.
Lets assume that the plot is generated by the function f(x), is there a method that would allow me to find the straight section in this plot?
Thank you.
I was hoping someone could help me with the following.
I have a plot of data that looks like an S.
I want to find 2 x points on the plot that resembles a straight and obtain those co-ordinates.
Attached is a picture of a plot which shaped as an S.
I have found the portion of the straight and marked them in green.
I wish to know the co-ordinates of these points.
Lets assume that the plot is generated by the function f(x), is there a method that would allow me to find the straight section in this plot?
Thank you.