You are using an out of date browser. It may not display this or other websites correctly.
You should upgrade or use an alternative browser.
You should upgrade or use an alternative browser.
Calculus graphing with conditions
- Thread starter algray09
- Start date
D
Deleted member 4993
Guest
This problem gives you almost step-by-step instructions.I’m confused on how to graph these conditions like where do I start?
Where do you start by plotting the two points described in the first condition provided.
D
Deleted member 4993
Guest
Please post an image of your work.I get the first part now and I know what to do when given one interval but having trouble with the multiple intervals
What I’ve done so far, the reason I’m having trouble is because my teacher briefly talked about it in class and went straight into polynomial functions the rest of class. Do I make a continuous line for the intervals? The intervals is what I’m more confused on
Attachments
D
Deleted member 4993
Guest
Which is your x-axis?What I’ve done so far, the reason I’m having trouble is because my teacher briefly talked about it in class and went straight into polynomial functions the rest of class. Do I make a continuous line for the intervals? The intervals is what I’m more confused on
Which is your y-axis?
You drew: where are the two points (-3,-1) & (0,0) for condition # 1


D
Deleted member 4993
Guest
I am afraid that that graph does not satisfy the condition(1)I figured it out
I don’t know how else to draw it then because it is concave up and concave down in the spots that it says to. It increases and decreases in the spots that it says too. Unless the -3 is where the concave up is then I’ll make it that but I asked how someone from class drew it and they were confused too but got that shape. I was more confused on the interval parts but they helped me out.
Dr.Peterson
Elite Member
- Joined
- Nov 12, 2017
- Messages
- 16,974
It may help if I describe what you drew, so you can see how it differs from what it should be.I don’t know how else to draw it then because it is concave up and concave down in the spots that it says to. It increases and decreases in the spots that it says too. Unless the -3 is where the concave up is then I’ll make it that but I asked how someone from class drew it and they were confused too but got that shape. I was more confused on the interval parts but they helped me out.
Here is what you were told:

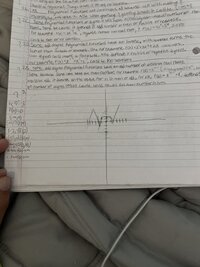
Here is your sketch:

Here is my description:
- [imath]f(-1) = 1, f(0) = 2[/imath]; both are wrong. You made a dot at (0,0), but didn't use it for the curve. You didn't even make a dot at (-1,-3), but have one at (0,-3).
- [imath]f(x)[/imath] is increasing on [imath](-\infty,-3.5), (-1.5,0), (2,\infty)[/imath]; these are similar to what was asked, but the numbers are wrong. I have to add that your axes are so irregular that it is hard to tell what you intended. The ticks should be spaced regularly.
- [imath]f(x)[/imath] is decreasing on [imath](-3.5,-1.5), (0,2)[/imath]
- [imath]f(x)[/imath] is concave up never; it is linear (constant slope, no concavity) on three segments. You need more curves.
- [imath]f(x)[/imath] is concave down on [imath](-1,1.5)[/imath]
- As [imath]x\to\infty, f(x)\to\infty[/imath]; correct.
- As [imath]x\to-\infty, f(x)\to-\infty[/imath]; correct. But you should have arrows on the ends to show this.