I'm not sure where to start, can someone help me. I am short on time and need help.
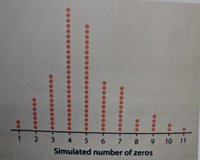
Charles claims he can act as a random number generator Samantha has doubts. She tells Charles to write down 50 random digits suspecting that he won't write down zero as often as he should. Charles includes only two zeros. Do these data provide convincing evidence that Charles produces fewer zeros than the expected 10%? Samantha simulated 100 trials of choosing 50 random digits assuming that 0 has a 1/10 chance of occurring each time. A)The doublet shows the number of zeros in each trial explain how the graph illustrates chance variation. B) Based on the results of the simulation, is there convincing evidence that Charles dosen't choose zero often enough when he's trying to generate random numbers? Explain.
Charles claims he can act as a random number generator Samantha has doubts. She tells Charles to write down 50 random digits suspecting that he won't write down zero as often as he should. Charles includes only two zeros. Do these data provide convincing evidence that Charles produces fewer zeros than the expected 10%? Samantha simulated 100 trials of choosing 50 random digits assuming that 0 has a 1/10 chance of occurring each time. A)The doublet shows the number of zeros in each trial explain how the graph illustrates chance variation. B) Based on the results of the simulation, is there convincing evidence that Charles dosen't choose zero often enough when he's trying to generate random numbers? Explain.
Attachments
Last edited:
