You are using an out of date browser. It may not display this or other websites correctly.
You should upgrade or use an alternative browser.
You should upgrade or use an alternative browser.
Applications of Exponential Functions: Evaluating whether a graph model is realistic
- Thread starter eutas1
- Start date
HallsofIvy
Elite Member
- Joined
- Jan 27, 2012
- Messages
- 7,760
No, for exponential growth, the value increases but there is a constant doubling period. If \(\displaystyle f(t_1)= Ce^{at_1}\) then \(\displaystyle 2f(t_1)= Ce^{at_2}\).
\(\displaystyle \frac{2f(t_1)}{f(t_1)}= 2= \frac{Ce^{at_2}}{Ce^{at_1}}= e^{a(t_2- t_1)}\)
\(\displaystyle a(t_2- t_1)= ln(2)\)
\(\displaystyle t_2- t_1= \frac{ln(2)}{a}\), a constant.
In fact, if you know the doubling period, it is easier to write the population as a power of 2 rather that e.
For the problem you post, you are told that the doubling period between 1500 and 1804 was 304 years and that in 1999 the predicted doubling period was 39 years. Obviously 39 is less than 304! You may be confusing "population" with "doubling period" of population.
The fact that the doubling period is less means that the population is increasing faster than exponential.
Last edited:
No, for exponential growth, the value increases but there is a constant doubling period. If \(\displaystyle f(t_1)= Ce^{at_1}\) then \(\displaystyle 2f(t_1)= Ce^{at_2}\).
\(\displaystyle \frac{2f(t_1)}{f(t_1)}= 2= \frac{Ce^{at_2}}{Ce^{at_1}}= e^{a(t_2- t_1)}\)
\(\displaystyle a(t_2- t_1)= ln(2)\)
\(\displaystyle t_2- t_1= \frac{ln(2)}{a}\), a constant.
In fact, if you know the doubling period, it is easier to write the population as a power of 2 rather that e.
For the problem you post, you are told that the doubling period between 1500 and 1804 was 304 years and that in 1999 the predicted doubling period was 39 years. Obviously 39 is less than 304! You may be confusing "population" with "doubling period" of population.
The fact that the doubling period is less means that the population is increasing faster than exponential.
Ah, I see that since it's an exponential graph, the doubling period is decreasing over time. But doesn't that make the graph ACCURATE? If the doubling period from 1500 to 1804 was 304 years, and in 1999 the predicted doubling period is 39 years, then the doubling period is DECREASING over time therefore isn't it ACCURATE ?
Dr.Peterson
Elite Member
- Joined
- Nov 12, 2017
- Messages
- 16,974
It's asking whether the exponential model from part (a) is accurate. The model has constant doubling time; the real population has decreasing doubling time.Ah, I see that since it's an exponential graph, the doubling period is decreasing over time. But doesn't that make the graph ACCURATE? If the doubling period from 1500 to 1804 was 304 years, and in 1999 the predicted doubling period is 39 years, then the doubling period is DECREASING over time therefore isn't it ACCURATE ?
Is it not clear that the model is inaccurate?
And how can you say, "since it's an exponential graph, the doubling period is decreasing over time"? That can't be true of an exponential graph!
What does the graph ACTUALLY SAY.
It says that population is increasing over time at an increasing rate.
That has nothing to do with the question.
The graph is built on the assumption of a constant doubling period. Does that conform to the historical evidence? Does that conform to common sense? After a while at that rate the world's population would exceed the number of atoms on earth and people would have to consist of a fraction of an atom.
The question was not whether the graph accurately portrays the model. The question was whether the model behind the graph makes any sense, is realistic.
It's asking whether the exponential model from part (a) is accurate. The model has constant doubling time; the real population has decreasing doubling time.
Is it not clear that the model is inaccurate?
And how can you say, "since it's an exponential graph, the doubling period is decreasing over time"? That can't be true of an exponential graph!
What does the graph ACTUALLY SAY.
It says that population is increasing over time at an increasing rate.
That has nothing to do with the question.
The graph is built on the assumption of a constant doubling period. Does that conform to the historical evidence? Does that conform to common sense? After a while at that rate the world's population would exceed the number of atoms on earth and people would have to consist of a fraction of an atom.
The question was not whether the graph accurately portrays the model. The question was whether the model behind the graph makes any sense, is realistic.
How do you know that the model has a constant doubling time? I thought the 39 years was only for 1999?
Also what I mean by "since it's an exponential graph, the doubling period is decreasing over time" is that because exponential graphs increase so rapidly, the distance for the x-values become smaller, therefore the doubling period becomes smaller for the graph.
I know because the problem says "assuming that the doubling period remains at 39 years."How do you know that the model has a constant doubling time? I thought the 39 years was only for 1999?
Also what I mean by "since it's an exponential graph, the doubling period is decreasing over time" is that because exponential graphs increase so rapidly, the distance for the x-values become smaller, therefore the doubling period becomes smaller for the graph.
I know because the problem says "assuming that the doubling period remains at 39 years."
Hmmmmmm okay,,, I think I might get it now. Thank you!!!
Dr.Peterson
Elite Member
- Joined
- Nov 12, 2017
- Messages
- 16,974
They came up with the exponential formula by assuming a constant doubling time.How do you know that the model has a constant doubling time? I thought the 39 years was only for 1999?
Also what I mean by "since it's an exponential graph, the doubling period is decreasing over time" is that because exponential graphs increase so rapidly, the distance for the x-values become smaller, therefore the doubling period becomes smaller for the graph.
Have you not been taught that an exponential function always has a constant doubling time? If the function is written as \(f(t) = Ce^{kt}\), then you can solve for the doubling time by solving \(f(t + T) = 2f(t)\) (that is, the population T years later is twice the population at time t:
\(Ce^{k(t+T)} = 2Ce^{kt}\)
\(e^{k(t+T)} = 2e^{kt}\)
\(e^{kt}e^{kT} = 2e^{kt}\)
\(e^{kT} = 2\)
\(T = \frac{ln(2)}{k}\)
This is what Halls showed in post #2. This time does not depend on t.
In fact, you can also express the function as \(f(t) = C(2)^{t/T}\)
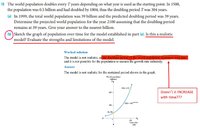
What you are seeing in the graph is that the population itself grows faster and faster. Look at a graph carefully to see the doubling time, and it should be clearer:

The horizontal green lines show successive doublings starting at 1/2; the vertical blue lines show that these are attained at a constant interval.
You may also have heard of "half-life"; that is the same idea, for exponential decay, and it, too is constant.
HallsofIvy
Elite Member
- Joined
- Jan 27, 2012
- Messages
- 7,760
?? You quote my post but this statement is the exact opposite of what I said!Ah, I see that since it's an exponential graph, the doubling period is decreasing over time.
I said that, for an exponential, the doubling period is constant.
But doesn't that make the graph ACCURATE? If the doubling period from 1500 to 1804 was 304 years, and in 1999 the predicted doubling period is 39 years, then the doubling period is DECREASING over time therefore isn't it ACCURATE ?
They came up with the exponential formula by assuming a constant doubling time.
Have you not been taught that an exponential function always has a constant doubling time? If the function is written as \(f(t) = Ce^{kt}\), then you can solve for the doubling time by solving \(f(t + T) = 2f(t)\) (that is, the population T years later is twice the population at time t:
\(Ce^{k(t+T)} = 2Ce^{kt}\)\(e^{k(t+T)} = 2e^{kt}\)\(e^{kt}e^{kT} = 2e^{kt}\)\(e^{kT} = 2\)\(T = \frac{ln(2)}{k}\)
This is what Halls showed in post #2. This time does not depend on t.
In fact, you can also express the function as \(f(t) = C(2)^{t/T}\)
What you are seeing in the graph is that the population itself grows faster and faster. Look at a graph carefully to see the doubling time, and it should be clearer:
View attachment 26347
The horizontal green lines show successive doublings starting at 1/2; the vertical blue lines show that these are attained at a constant interval.
You may also have heard of "half-life"; that is the same idea, for exponential decay, and it, too is constant.
No, I don't think I was taught that an exponential function always has a constant doubling time... Thank you very much!
?? You quote my post but this statement is the exact opposite of what I said!
I said that, for an exponential, the doubling period is constant.
Oh yeah sorry, I misunderstood the whole thing at first!