ASAP Help with whether or not f is continuous on an interval

avie_j

New member
Joined
Sep 16, 2021
Messages
11
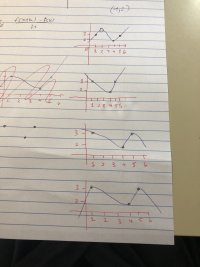
Hi. I'm stuck on this homework question. The question itself and my work so far is attached.

Basically, the only option that makes sense to me is f(2) < 3 because the function at x=2 is less than 3. But, someone I know had that same answer and it's wrong.

Can someone please explain how I continue the graph and how there's other options that must be true?

I appreciate all your help. Even if it's just a hint. :)

3A07DF44-90E8-4FEA-82B6-D91ED818DF5E.jpeg

C70A02D4-4C83-4BAD-8E33-9E0B4BFE316F.jpeg
 
Help with whether or not f is continuous on an interval
Hi Avie. We're told that function f is continuous from x=0 to x=6. There won't be any breaks in the curve.

Your graph shows one possibility, assuming you extend your lines to x=0 and x=6. There are a few other possibilities.

Thinking about the three known points (1,3) (4,2) (5,3), we ought to consider the possibilities of the curve passing though a point or turning around there instead (i.e., a local maximum or minimum function value at that point). We could even have both of those situations occur with the same curve. Also, the graph may approach those points from either above or below, so incorporate those possibilities, too.

How the graph behaves from x=0 to x=1 is your choice, in each sketch. Same goes for x=5 to x=6. Just make sure that each curve you sketch for f(x) doesn't cross and/or touch the line y=3 more than twice.

When you think you've sketched every possible combination of attributes, try answering the question again.

?
 
Hi Otis! Thank you so much for your reply!

I don't know if I've drawn every possibility but these are what I've drawn so far.

Now I think that none of them MUST be true because in the case with the first graph, the point f(2) could be greater than 3.
 

Attachments

  • IMG-5622.jpg
    IMG-5622.jpg
    1.3 MB · Views: 6
Your 1st clearly is not continuous as it is not continuous at x=2.
Also, there are 3 solutions to f(x)=3 in your 1st graph.
On all of your graphs you went outside of [0,6]. Why is that?
 
Your 1st clearly is not continuous as it is not continuous at x=2.
Sorry, that's not meant to be an open dot (even though it looks like it). I just circled where the y value of 2 is
 
To the left of (1,3) must the graph go up, go down or either up or down?
Same question for the right of (6,3)
 
That is true. Are any of the other choices valid as well?
To the left of (1,3) must the graph go up, go down or either up or down?
Same question for the right of (6,3)
I'm not sure since I could draw it going up or down.
If I had to guess, I'd say that to the right of (5,3) the graph goes up since at the point (5,3) it shows it increasing.
I could say that since it's increasing towards 1 then it could also be going up.
 
When you think you've sketched every possible combination of attributes, try answering the question again.
I would not use this approach. The question is "which must be true", not "which may be true". Of course, your approach works: for f(0)>3 we can review all the written down possibilities and observe that f(0) can be greater than 3 and less than 3 and conclude that this is not a "must". But what about problems where the number of possibilities is tens or hundreds? Writing them all down would not be feasible.
Instead, I would consider each potential "must" and find only one counter example to eliminate it or justify why it really is a "must".
 
I think that none of them MUST be true because in the case with the first graph, the point f(2) could be greater than 3.
Very good. And your second and fourth graphs show that f(6) and f(0) do not have to be greater than 3.

?
 
what about problems where the number of possibilities is tens or hundreds?
Hi Lev. I think I'll wait 'till I get to that bridge, to answer. ;)

I was pushing the OP towards gaining more experience visualizing and graphing, as I believe they would benefit from that. (I wasn't trying to suggest a general method.) I'm pleased they deduced the correct answer with fewer graphs, nonetheless!

:)
 
Top