Hi,
I am trying to come up with an equation/factor possibly? I'm not truly sure what I'm looking for as I only know the figures I have in front of me, but not how to equate an answer.
I have a task at my metrology work place to come up with a formula perhaps? with using a simple data outcome that's been fed back to me.
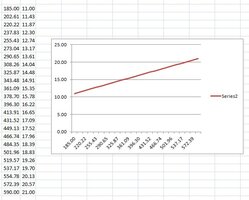
If 185 is 11
and
If 590 is 21
How do I go about calculating the possibility of 300?
I have plotted an excel sheet and used series to complete numbers in between and plotted a chart but I'm now stuck on figuring out the formula used to find what 300 equals.
(300 is an example figure, ideally I would like any number to be in the range that would calculate the smaller value)
In the chart I can see there would be a 300 answer but my mind today is absolutely blank to figure the answer!
I would be eternally grateful for the help to working out the formula.
Thank you.
I am trying to come up with an equation/factor possibly? I'm not truly sure what I'm looking for as I only know the figures I have in front of me, but not how to equate an answer.
I have a task at my metrology work place to come up with a formula perhaps? with using a simple data outcome that's been fed back to me.
If 185 is 11
and
If 590 is 21
How do I go about calculating the possibility of 300?
I have plotted an excel sheet and used series to complete numbers in between and plotted a chart but I'm now stuck on figuring out the formula used to find what 300 equals.
(300 is an example figure, ideally I would like any number to be in the range that would calculate the smaller value)
In the chart I can see there would be a 300 answer but my mind today is absolutely blank to figure the answer!
I would be eternally grateful for the help to working out the formula.
Thank you.