Hi guys, I've done the trapezium and simpsons rule and the question is asking me to compare the values to the exact value. I've have written the exact value in (iii) I have no idea what to write about the comparison here. Can anyone help?
You are using an out of date browser. It may not display this or other websites correctly.
You should upgrade or use an alternative browser.
You should upgrade or use an alternative browser.
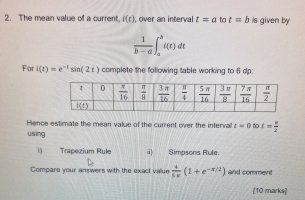
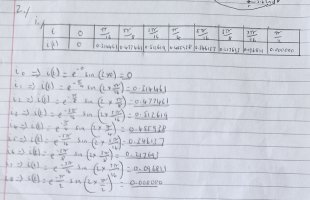
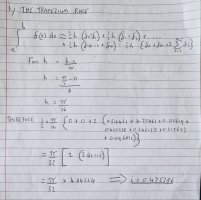
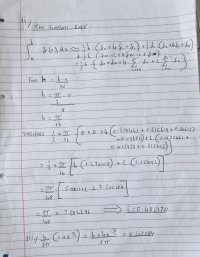
Comparing answers and comment
- Thread starter Bener123
- Start date
BeachBanana
Senior Member
- Joined
- Nov 19, 2021
- Messages
- 2,281
Clearly, the approximations are higher than the actual value.
Comment on why that is.
Can you improve the approximations? If so, how?
Pros and cons of Simpson's / Trapezoid Rule
That should be sufficient, IMO.
Comment on why that is.
Can you improve the approximations? If so, how?
Pros and cons of Simpson's / Trapezoid Rule
That should be sufficient, IMO.
BeachBanana
Senior Member
- Joined
- Nov 19, 2021
- Messages
- 2,281
Those questions are for you to answer.Yeah the approximations are high, I just don't know why. Is it because the Trapezoid and SImpsons rule are both averages? How can you improve the approximations?
How is the Simpson's Rule and the Trapezoid rule approximating the area under the curve? Read about them. Research them. Understand them. Look into your notes, etc...
Once you know how they are approximating the area, you can answer my questions in post#2.
No better teacher in life than experience.
Steven G
Elite Member
- Joined
- Dec 30, 2014
- Messages
- 14,605
Draw a function, any function, other than a straight line. You do not need to know what the function is. Label x=a and x=b on the the x-axis. Now partition this interval into say 4 equal size regions. Now draw the trapezoid in each region. Do you see why you are not getting the exact area?
Yes, there is a formula to approximate the area under the curve using these formulas but these formulas can be understood, not blindly memorized.
Please post back with your work and diagram and we'll help you from there.
Yes, there is a formula to approximate the area under the curve using these formulas but these formulas can be understood, not blindly memorized.
Please post back with your work and diagram and we'll help you from there.
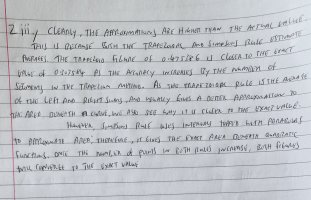
I've just written this and will hope for the best. Let me know what you think.Draw a function, any function, other than a straight line. You do not need to know what the function is. Label x=a and x=b on the the x-axis. Now partition this interval into say 4 equal size regions. Now draw the trapezoid in each region. Do you see why you are not getting the exact area?
Yes, there is a formula to approximate the area under the curve using these formulas but these formulas can be understood, not blindly memorized.
Please post back with your work and diagram and we'll help you from there.
Attachments
Harry_the_cat
Elite Member
- Joined
- Mar 16, 2016
- Messages
- 3,779
@Bener123, Steven G has given you great advice in post #5. If you really want to understand the question and give a better answer, I would also suggest you draw the graph (use technology if you want) and draw in the trapeziums. You should be able to better explain why the approximation is over- estimating or under-estimating the true value.
If you can supply the graph and draw the trapeziums, that would be heavily appreciated and I'll buy you a drink! I'm doing 3 modules at once in this degree and I'm really struggling to find the time to do all of this so any help will be greatly appreciated.