martin.g25
New member
- Joined
- Feb 10, 2023
- Messages
- 6
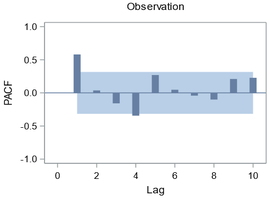
I'm not so sure that's a CI. The PACF is a descriptive statistic that summarizes the properties of a given time series, and it is not a population parameter that can be estimated from a sample of data. Therefore, it is also not appropriate to use a confidence interval to estimate the uncertainty in the value of the PACF.Hello, could anybody please explain me how the confidence interval (the blue background on the plot) is calculated in the PACF plot? In my case it should be 0.3162 and -0.3162.
Thank you.
I've looked into it a bit more. Though it's uncommon, yes, you can calculate the confidence interval for PACF but at each lagMaybe it is not a confidence level. I am not sure, therefore I am asking...
For the blue background there is a pertaining label "Two Standard Errors". Do this help?
I get the plots using this simple SAS code:
proc arima data=VZORKA plots(unpack)=all;
identify var="YOUR_VARIABLE" nlag=12;
ods output SeriesACFPlot=SAP SeriesPACFPlot=SPP;
run;
That's the point. The CI varies for each lag. So whatever that box is, it's not CI.Based on your formula I would get different CL level for different PACF values. However, on the plot you can see that the "blue background" has the same boundaries for each PACF value. These boundaries are 0.3162 and -0.3162.
Or am I missing something?
Thank you.