deleted_user
New member
- Joined
- May 18, 2022
- Messages
- 6
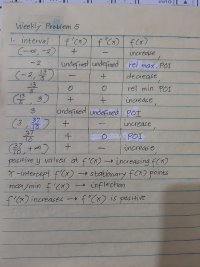
I am not sure if I have the right answers, I'm confused as to how f will be when f'(x) approaches a vertical asymptote. Here is what i have so far. POI is point of inflection.
View attachment 32762
From -oo to x=-2, the derivative goes from oo to 1. That is on f(x), the slope goes from oo (ie vertical) to 1. Now draw that from -oo to 1.I am not sure if I have the right answers, I'm confused as to how f will be when f'(x) approaches a vertical asymptote. Here is what i have so far. POI is point of inflection.
View attachment 32762
Absolutely. In particular, you can start at any point you want, and pay attention only to the general shape. It's only a possible sketch.The point I would stress is that there is no hint that this problem has a unique answer.
It appears that you are permitted to choose plausible functions to work with. For example, the rightmost segment resembles a hyperbola so assume it is a hyperbola. What might the function describing that hyperbola be? From what kind of functions would you get such a derivative?
True, and highly pertinent if the student has not been introduced to integration.I'd go beyond that: We don't even need to imagine (the pieces of) the function having equations at all, which could lead to worrying about integrating them.
i see, an point of inflection would be when concavity changes, so they wouldn't be a relative maximum and minimum.How can a relative max or min be a point of inflection? And why do you have a POI at 37/10?
It would be more helpful to see your attempt at a graph, which we could check out more easily. In your table, I would expect to see mentions of concavity, and perhaps of sharp turns.
But what you say for x=3 is correct, just perhaps not as complete as you wish. Please either tell us more about what you think happens there, or show us your attempt at a graph. Either way, we'll have a better idea of how you are confused.
Sort of my point. The idea of the inverse of a derivative is inherent in the problem. Now if the student has not been introduced to anti-derivatives, this problem may spark an “ah-ha moment.” If the student has been introduced to anti-derivatives, this problem should spark an “ah-ha“ moment. But Dr. Peterson was right to correct me. You do not need anti-derivatives to address this problem. More basic tools suffice. But if you own a bulldozer, you tend to forget about shovels.You don't need to have studied anything about integration to know how to solve basic antiderivates.
One of the pieces of f'(x) looks like 1/x to me. A student who never studied integrals should now that if f'(x)= 1/x.
our teacher does tables, so i assumed it would be the right way to go.From -oo to x=-2, the derivative goes from oo to 1. That is on f(x), the slope goes from oo (ie vertical) to 1. Now draw that from -oo to 1.
From x=-2 to 3, the derivative goes from -2 to oo. That is on f(x), the slope goes from -2 to oo (vertical). Draw this
From x=3 to x=oo, the derivative goes from oo to 0. That is on f(x), the slope goes from oo (ie vertical) to 0. Draw this.
You do not need a table to do such a problem.
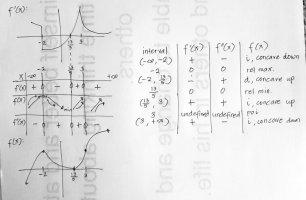
i forgot to place the concavities, but negative f''(x) would be concave downs and concave up for positive f''(x).
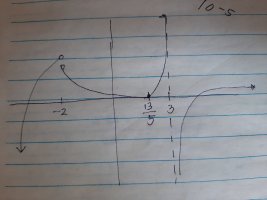
i am not sure about sharp turns, but would it be where the vertical asymptote of 3 is? when the value of x approaches 3, the value of y increases to positive infinity. but it would never reach 3 and be undefined there.
and here is what i think the graph would be.
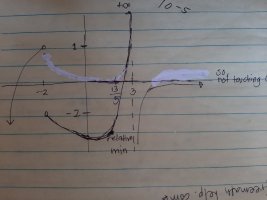
First, you missed the fact that f is supposed to be continuous everywhere! Remove those discontinuities. In doing so, you may discover what I mean about sharp turns. (This is also a reason that the idea of thinking of the [imath](3,\infty)[/imath] portion as a hyperbola can be counterproductive.)i adjusted the graph such that (3,+inf) does not get to 0 just like the f'(x) graph.
the y at -2 below would be at y -2 too?
do you mean like this? oh the right part should not go beyond 0First, you missed the fact that f is supposed to be continuous everywhere! Remove those discontinuities. In doing so, you may discover what I mean about sharp turns. (This is also a reason that the idea of thinking of the (3,\infty)(3,∞) portion as a hyperbola can be counterproductive.)

ooh i see, i believe we'll be learning this in the next school year!Also, it doesn't matter what the actual values of y are in your graph; the whole thing could be shifted up or down without affecting the derivative. (That's a point you'll learn when you get to integration and the antiderivative.)
i meant will the open points at the graph of f'(x) be the same placement as at the f(x) graph?I'm not sure what you mean by "y at -2 below would be at y -2". Do you mean the graph to the left of x=-2 should be a constant, y=-2 ??
since it is an x-intercept at the f'(x) graph, its a stationary point, so it would be the same placement in f(x)?Finally, a much more minor point, your relative minimum doesn't look like it's at the right place.
i think i get it!continuous everywhere