You are using an out of date browser. It may not display this or other websites correctly.
You should upgrade or use an alternative browser.
You should upgrade or use an alternative browser.
Derivatives of Expo., Sinusoidal Fncs: Codeine phosphate is used as a painkiller.
- Thread starter noah8999
- Start date

Challenging Derivatives of Exponential and Sinusoidal Functions task question
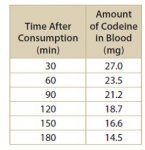
Codeine phosphate is a drug used as a painkiller. Generally, it is mixed with acetaminophen in tablet form. It is rapidly absorbed into the bloodstream from the gastrointestinal tract and is gradually eliminated from the body via the kidneys. A common brand contains 30 mg of codeine. Since it is physically addictive and has other unwanted side effects, it is important to avoid an overdose while helping to relieve pain symptoms such as those caused by a headache. Samples of blood were taken at regular time intervals from a patient who had taken a pill containing 30 mg of codeine. The amount of codeine in the bloodstream was determined every 30 min for 3 h. The data are shown in the table below. (Table is ATTACHED)

a) Create a scatter plot of the data and determine a suitable equation to model the amount of codeine in the bloodstream t min after taking the pill. Justify your choice of models.
b) Use the model to determine the instantaneous rate of change in the amount of codeine at each time given in the chart. How does it relate to the amount of codeine in the blood?
c) It is recommended that a second pill be taken when 90% of the codeine is eliminated from the body. When would this occur?
d) Assume that the same model applies to the second pill as to the first. Suppose the patient took a second pill one hour after consuming the first pill.
• Create a model for the amount of codeine in the patient’s bloodstream t min after taking the first pill.
• Determine the maximum amount of codeine in the patient’s bloodstream.
• Determine when 90% of the maximum amount would be eliminated from the body.
e) If the patient were to delay taking the second pill, how would it affect the results from part d)?
Codeine phosphate is a drug used as a painkiller. Generally, it is mixed with acetaminophen in tablet form. It is rapidly absorbed into the bloodstream from the gastrointestinal tract and is gradually eliminated from the body via the kidneys. A common brand contains 30 mg of codeine. Since it is physically addictive and has other unwanted side effects, it is important to avoid an overdose while helping to relieve pain symptoms such as those caused by a headache. Samples of blood were taken at regular time intervals from a patient who had taken a pill containing 30 mg of codeine. The amount of codeine in the bloodstream was determined every 30 min for 3 h. The data are shown in the table below. (Table is ATTACHED)
a) Create a scatter plot of the data and determine a suitable equation to model the amount of codeine in the bloodstream t min after taking the pill. Justify your choice of models.
b) Use the model to determine the instantaneous rate of change in the amount of codeine at each time given in the chart. How does it relate to the amount of codeine in the blood?
c) It is recommended that a second pill be taken when 90% of the codeine is eliminated from the body. When would this occur?
d) Assume that the same model applies to the second pill as to the first. Suppose the patient took a second pill one hour after consuming the first pill.
• Create a model for the amount of codeine in the patient’s bloodstream t min after taking the first pill.
• Determine the maximum amount of codeine in the patient’s bloodstream.
• Determine when 90% of the maximum amount would be eliminated from the body.
e) If the patient were to delay taking the second pill, how would it affect the results from part d)?
Attachments
Last edited by a moderator:
D
Deleted member 4993
Guest
What are your thoughts regarding the assignment?Codeine phosphate is a drug used as a painkiller. Generally,it is mixed with acetaminophen in tablet form. It israpidly absorbed into the bloodstream from the gastrointestinal tract and is gradually eliminated from the body via the kidneys. A common brand contains 30 mg of codeine. Since it is physically addictive and has other unwanted side effects, it is important to avoid an overdose while helping to relieve pain symptoms such as those caused by a headache. Samples of blood were taken at regular time intervals from a patient who had taken a pill containing 30 mg of codeine. The amount of codeine in the bloodstream was determined every 30 min for 3 h. The data are shown in the table below. (Table is ATTACHED)
a) Create a View attachment 9583scatter plot of the data and determine a suitable equation to model the amount of codeine in the bloodstreamt min after taking the pill. Justify your choice of models.
b) Use the model to determine the instantaneous rate of change in the amount of codeine at each time given in the chart. How does it relate to the amount of codeine in the blood?
c) It is recommended that a second pill be taken when 90% of the codeine is eliminated from the body. When would this occur?
d) Assume that the same model applies to the second pill as to the first. Suppose the patient took a second pill one hour after consuming the first pill.
• Create a model for the amount of codeine in the patient’s bloodstream t min after taking the first pill.
• Determine the maximum amount of codeine in the patient’s bloodstream.
• Determine when 90% of the maximum amount would be eliminated from the body.
e) If the patient were to delay taking the second pill, how would it affect the results from part d)?
Please share your work with us ...even if you know it is wrong.
If you are stuck at the beginning tell us and we'll start with the definitions.
You need to read the rules of this forum. Please read the post titled "Read before Posting" at the following URL:
http://www.freemathhelp.com/for
HallsofIvy
Elite Member
- Joined
- Jan 27, 2012
- Messages
- 7,760
Part (a) of this problem says "create a scatter plot". Have you done that? Do you know what a "scatter plot" is? Once you have done that, the simplest "model" is linear. Do these points look like they lie, roughly, along a straight line? If they do then you can just use two points to determine the "a" and "b" in y= ax+ b.
Part (a) of this problem says "create a scatter plot". Have you done that? Do you know what a "scatter plot" is? Once you have done that, the simplest "model" is linear. Do these points look like they lie, roughly, along a straight line? If they do then you can just use two points to determine the "a" and "b" in y= ax+ b.
I created a few equations using my scattered points including linear and exponential but I can't decide which to use. The linear regression equation is the most accurate but this question is from the unit of "Exponential and Sinusoidal derivatives" so I am a bit hesitant to use the linear equation. What do you think?
My linear equation is y=-0.0812t+28.82
My exponential equation is y=30.39131111e^-0.00407305897x
I also got this y=30(0.5)^t/3.29
D
Deleted member 4993
Guest
I created a few equations using my scattered points including linear and exponential but I can't decide which to use. The linear regression equation is the most accurate but this question is from the unit of "Exponential and Sinusoidal derivatives" so I am a bit hesitant to use the linear equation. What do you think?
My linear equation is y=-0.0812t+28.82
My exponential equation is y=30.39131111e^-0.00407305897x
I also got this y=30(0.5)^t/3.29
What are the respective R2 values?
What are the respective R2 values?
-0.9957680415 for the linear equation
-0.99939835 for the exponential equation
ilikemath123123
New member
- Joined
- Jun 11, 2018
- Messages
- 2
Need solution for Unit 4 Derivatives of Exponential and Sinusoidal Functions Task

I made a graph but dont know what to do from there please help.
I made a graph but dont know what to do from there please help.
stapel
Elite Member
- Joined
- Feb 4, 2004
- Messages
- 16,543
You "made a graph" of what? Have you completed part (a)? If so, on which later part are you working?
a) Create a scatter plot of the data and determine a suitable equation to model the amount of codeine in the bloodstreamt min after taking the pill. Justify your choice of models.
b) Use the model to determine the instantaneous rate of change in the amount of codeine at each time given in the chart. How does it relate to the amount of codeine in the blood?
c) It is recommended that a second pill be taken when 90% of the codeine is eliminated from the body. When would this occur?
d) Assume that the same model applies to the second pill as to the first. Suppose the patient took a second pill one hour after consuming the first pill.
• Create a model for the amount of codeine in the patient’s bloodstream t min after taking the first pill.
• Determine the maximum amount of codeine in the patient’s bloodstream.
• Determine when 90% of the maximum amount would be eliminated from the body.
e) If the patient were to delay taking the second pill, how would it affect the results from part d)?
I made a graph but dont know what to do from there please help.
Please be complete. Thank you!
")
D
Deleted member 4993
Guest
Please share your thoughts/work and tell us exactly where you are stuck!,please solve the whole question
D
Deleted member 4993
Guest
That is not an equation - there is no "equal to" ( = ) sign in that statement.Heyy so i got my equation as 30e^-3.512t but i think i'm wrong so i'm stuck
How did you arrive at that expression? Please share your work/thoughts !!