You are using an out of date browser. It may not display this or other websites correctly.
You should upgrade or use an alternative browser.
You should upgrade or use an alternative browser.
Does anyone know how to graph log functions????
- Thread starter ironsheep
- Start date
You SKETCH log functions the same way you do any function. You plot a number of points and then connect them with a smooth curve, meaning one with no sudden changes in slope. (When you get to calculus, you will learn more sophisticated methods involving "critical points.")
[MATH]f(x) = log_{10}(x)[/MATH].
[MATH]f(-\ 2)= 0.01[/MATH]
[MATH]f(-\ 1)= 0.1[/MATH]
[MATH]f(0) = 1.[/MATH]
[MATH]f(0.5) \approx 3.2.[/MATH]
[MATH]f(1) = 10.[/MATH]
[MATH]f(1.125) \approx 13.3.[/MATH]
This is exactly what a graphing calculator does except with many more points.
[MATH]f(x) = log_{10}(x)[/MATH].
[MATH]f(-\ 2)= 0.01[/MATH]
[MATH]f(-\ 1)= 0.1[/MATH]
[MATH]f(0) = 1.[/MATH]
[MATH]f(0.5) \approx 3.2.[/MATH]
[MATH]f(1) = 10.[/MATH]
[MATH]f(1.125) \approx 13.3.[/MATH]
This is exactly what a graphing calculator does except with many more points.
Dr.Peterson
Elite Member
- Joined
- Nov 12, 2017
- Messages
- 16,974
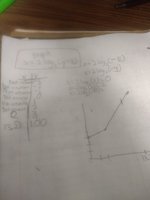
You really need to learn to use your camera better! (Or use screenshots.) Avoid those horrible reflections, and try again if a picture doesn't turn out. But here's an attempt at fixing up the first:

Now, here's how I would graph x = 2 log_2(y-2). First, I'd solve it for y, both because it is written as an inverse, and because exponentials are easier to graph. Then I'd pick values for x like -2, -1, 0, 1, 2, and plot them.
Or, after solving for y, I'd look at the transformations that change y = 2^x to your function, and apply those to the graph of y = 2^x. That makes it much easier to choose points to plot.
If I had to graph this as given, with y the input, I would again use transformations. To plot x = log_2(y), I'd really plot y = 2^x, which is easy. Then I'd shift each point 2 units up (since that's a shift in the y direction) and double x.
Frankly, this is an ugly problem in several ways, so you might do better asking for help on a more typical problem written as y = ..., so we could get you up to speed on the basics.
First of all, I just divide by choosing a y value first. For example, if I give the y a value of 100, it would be log(98)/log(2) and then multply that by 2 and you would get 13.23. I am not going to put it in a form without the log. What am I doing wrong with my graphing???
Harry_the_cat
Elite Member
- Joined
- Mar 16, 2016
- Messages
- 3,779
Remember that log (a) is only defined if a is positive. So log (y-2) is only defined if y-2>=0. ie y>=2. That's why the calculator says what it does. So there will be no part of your graph under or on the line y=2.If you give the Y-value a negative number, then the calculator will say "Not a number"
You say: "What am I doing wrong with my graphing???"
If you are going to draw the graph by plotting points, you simply need a lot more points, and join them with a smooth curve not straight lines.
Try y= 2.5 y=2.1, y=2.01 for example.
You also say: "I am not going to put it in a form without the log." But that would be the best way to graph this question.
\(\displaystyle x=2*log_2{(y-2)}\)
\(\displaystyle \frac{x}{2}= log_2{(y-2)}\)
\(\displaystyle y-2=2^{\frac{x}{2}}\)
\(\displaystyle y=2^{\frac{x}{2}}+2\)
Can you graph that exponential function either
1. by plotting points as before
OR even better (2) by considering transformations of the graph of \(\displaystyle y=2^x\) ?
Last edited:
Otis
Elite Member
- Joined
- Apr 22, 2015
- Messages
- 4,589
Can you post the exercise statement verbatim? In this graphing exercise, I'm not sure if y is the independent variable or the dependent variable. In the former, the y-axis is horizontal; in the latter, the x-axis is horizontal.... What am I doing wrong with my graphing???
?
Last edited:
Otis
Elite Member
- Joined
- Apr 22, 2015
- Messages
- 4,589
log2(y - 2) is undefined (in the Real number system) for any value of y that's 2 or less.If you give the Y-value a negative number, then the calculator will say "Not a number"
You ought to have been taught that logarithmic inputs must be positive numbers. The expression y-2 is not positive, when y is 2 or less.
?
Remember that log (a) is only defined if a is non-negative. So log (y-2) is only defined if y-2>0. ie y>2. That's why the calculator says what it does. So there will be no part of your graph under the line y=2.
You say: "What am I doing wrong with my graphing???"
If you are going to draw the graph by plotting points, you simply need a lot more points, and join them with a smooth curve not straight lines.
Try y= 2.5 y=2.1, y=2.01 for example.
You also say: "I am not going to put it in a form without the log." But that would be the best way to graph this question.
\(\displaystyle x=2*log_2{(y-2)}\)
\(\displaystyle \frac{x}{2}= log_2{(y-2)}\)
\(\displaystyle y-2=2^{\frac{x}{2}}\)
\(\displaystyle y=2^{\frac{x}{2}}+2\)
Can you graph that exponential function either
1. by plotting points as before
OR even better (2) by considering transformations of the graph of \(\displaystyle y=2^x\) ?
I don't know how to flip the variables around and end up with an exponential form with no logs--- that is why I keep with the log form
Harry_the_cat
Elite Member
- Joined
- Mar 16, 2016
- Messages
- 3,779
Yeah what you've done is correct (although I don't think it's the best way). You just haven't got enough points to complete the graph.

Otis
Elite Member
- Joined
- Apr 22, 2015
- Messages
- 4,589
Except (using your calculator) you didn't get the same answers.Besides you get the same answers anyway …
")
I see from the choices that they're treating y as the dependent variable. Remember, y must be greater than 2. The answer is D.
\(\;\)
Otis
Elite Member
- Joined
- Apr 22, 2015
- Messages
- 4,589
You can google for lessons, but the main part in solving the given equation for y is understanding how to switch between logarithmic and exponential form. That comes directly from the definition of logarithms. Logarithms are a special way of writing exponents.I don't know how to flip the variables around and end up with an exponential form ...
b^n = P
The base is b, the exponent is n and the resulting power (of b) is P
If we want to express that exponent in terms of a logarithm, then we write:
n = logb(P)
That logarithmic equation tells us that n is the exponent to which b must be raised, in order to get the power P -- in other words:
b^n = P
In your exercise, we have:
x = 2∙log2(y - 2)
Divide each side by 2, to isolate the logarithm (that is, to get the form n=logb[P]):
x/2 = log2(y - 2)
Remember: Logarithms are exponents. That logarithmic equation tells us that x/2 is the exponent to which 2 must be raised, in order to get the power y-2:
2^(x/2) = y - 2
We just switched from the given logarithmic form to exponential form. Solve for y:
y = 2^(x/2) + 2
or
y = √[2^x] + 2
Alternatively, we could apply the change-of-base formula to the given equation (to change from base-2 to base-e), and then switch to exponential form. Solving that for y would yield a third version of the same inverse function:
y = e^[x∙ln(2)/2] + 2
?
I think it was because of being able to switch around things without needing the log. For the question, instead of looking at it as x =2 log(y-2), just look at it as x = log subscript 2 times y. That would mean as you exchange---- 2 to the power of x = 2 (Y-2). Y equals (2 to the power of x) plus 4 and all of that is divided by 2. Just have to make the formula look simpler, which will allow me to get rid of the log
JeffM said:[MATH]f(x) = log_{10}(x)[/MATH].
[MATH]f(-\ 2)= 0.01[/MATH]
[MATH]f(-\ 1)= 0.1[/MATH]
[MATH]f(0) = 1.[/MATH]
[MATH]f(0.5) \approx 3.2.[/MATH]
[MATH]f(1) = 10.[/MATH]
[MATH]f(1.125) \approx 13.3.[/MATH]
This is exactly what a graphing calculator does except with many more points.
You have all of those backward. f(x) is the value of the function when evaluated
at x.
Starting with the first one, it needs to be: f(0.01) = -2,
because 10^(-2) = 0.01.
Otis
Elite Member
- Joined
- Apr 22, 2015
- Messages
- 4,589
I don't understand "log2 times y", but I do have some final comments on this exercise. In the op, you had made it sound like this was a graphing exercise. But, it's not. They gave you the graph.… instead of looking at it as x=2*log2(y-2), just look at it as x=log2 times y …
I had thought it awkward for an exercise to ask students to graph x=2∙log2(y-2) because that's a logarithmic function except that the independent and dependent variables have been switched. (I wasn't sure who switched the variables, and I've seen instructors do some weird presentations with coordinate axes.) This is why I asked to see the complete exercise statement (you provided it in post #12). This is also why the forum guidelines ask students to post exercises as given. Once I saw the actual exercise, the axis labels made clear that x=2∙log2(y-2) represents the inverse of function y=2∙log2(x-2).
Others may disagree, but to me the exercise is not asking you to find coordinates of points or to draw a graph. I think the intent is for students to use attributes they were taught regarding shapes of logarithmic and exponential curves, graph shifts (i.e., all inputs or outputs changed by a constant) and the reflective graph symmetry about the line y=x between a curve and its inverse. In other words, this exercise can be answered without doing any numerical calculations.
The graph of y=2∙log2(x-2) is the graph of y=2∙log2(x) shifted two units to the right. In other words, we know the line x=2 is a vertical asymptote because we've learned the general shape of logarithmic function graphs. We reflect the shifted graph across the line y=x, to identify the inverse graph x=2∙log2(y-2). Everything gets reflected across the line y=x -- including the asymptote. That is, the vertical asymptote x=2 becomes the horizontal asymptote y=2 on the inverse graph, and the exponential curve must be increasing over its domain. So, we can eliminates choices A, B and C right away -- without solving for y or finding points.
?
pka
Elite Member
- Joined
- Jan 29, 2005
- Messages
- 11,978
To ironsheep. Do you really read \(\displaystyle \log_2(y)\) as "log base 2 times y "?instead of looking at it as x =2 log(y-2), just look at it as x = log subscript 2 times y. That would mean as you exchange---- 2 to the power of x = 2 (Y-2). Y equals (2 to the power of x) plus 4 and all of that is divided by 2. Just have to make the formula look simpler, which will allow me to get rid of the log
Do you read \(\displaystyle f(y)\) as "f times y" ? You should know that \(\displaystyle \log_2(y)\) is just a function of \(\displaystyle y\) no different from \(\displaystyle f(y)\).
You need to be comfortable this notation. \(\displaystyle y=\log_b(x)\) means that \(\displaystyle x>0\) and has an equivalent form \(\displaystyle b^y=x\)
\(\displaystyle \log_t(2y-1)=6\) means \(\displaystyle t^6=2y-1\).
But most standard testing expect you to know this basic conversion:
\(\displaystyle \Large{\log_b(x)=\dfrac{\log(x)}{\log(b)}}\) Using that we have standard answers,