You are using an out of date browser. It may not display this or other websites correctly.
You should upgrade or use an alternative browser.
You should upgrade or use an alternative browser.
Find the Area Of the Region
- Thread starter KEYWEST17
- Start date
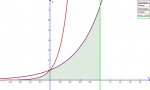
I assume the shaded region is the area in question?.
Find the area under \(\displaystyle e^{2x}\) from 0 to 1:
\(\displaystyle \int_{0}^{1}e^{2x}dx\)
Find the area under \(\displaystyle e^{6x}\) from \(\displaystyle -\infty \;\ \text{to} \;\ 0\):
\(\displaystyle \int_{-\infty}^{0}e^{6x}dx\)
Add them up.
This is assuming my assessment is correct and I have the correct region as in the diagram.
But, if you need the region between the two e functions: \(\displaystyle \int_{-\infty}^{0}\left[e^{2x}-e^{6x}\right]dx\)
Attachments
KEYWEST17 said:I plugged the equations into the graphing calculator and can see the areas to evaluate but I am stuck.
KEYWEST17,
you are also to include y = 0, as another curve to form the region,
if it is supposed to be the figure drawn by galactus.
I am unsure of what region you are looking for.
Is it \(\displaystyle \int_{0}^{1}e^{2x}dx\)?.
Or
\(\displaystyle \int_{-\infty}^{0}\left(e^{2x}-e^{6x}\right)dx\)?.
Or both?.
Or something else?.
The problem may indicate both.
\(\displaystyle \int_{-\infty}^{0}\left(e^{2x}-e^{6x}\right)dx+\int_{0}^{1}e^{2x}dx\)
Show us what you're doing so we can pinpoint the trouble.