MuddledMaths
New member
- Joined
- Oct 10, 2022
- Messages
- 23
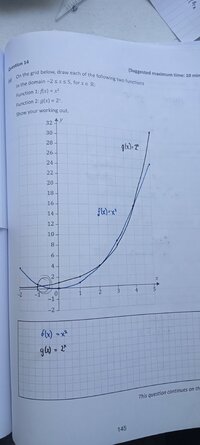
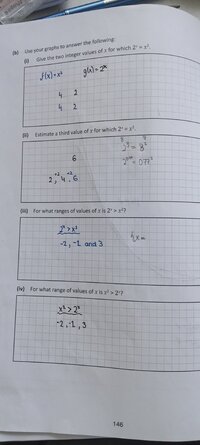
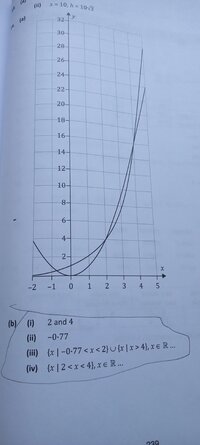
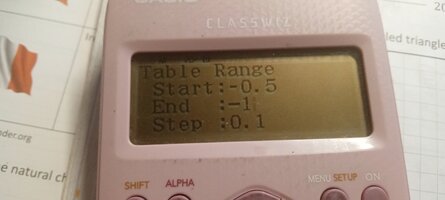
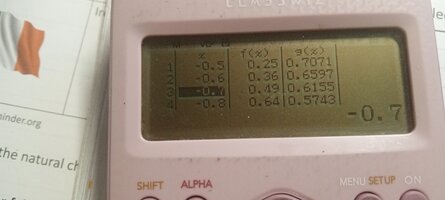
Hey I'm having troubles with this question hope you guys can help? It's about functions
Ignore the writing btw, only the top one is right :/
The answers didn't make much sense to me.
Ignore the writing btw, only the top one is right :/
The answers didn't make much sense to me.


")