Probability
Full Member
- Joined
- Jan 26, 2012
- Messages
- 433
So its not a college course but what I refer to as CPD training. I'm working my way through some maths training books at this time and just starting to look at graphs. This particular graph I have plotted using Excel, now I'm no expert with Excel either so my reason for posting this is to try and get some feedback on what I can actually do using Excel.
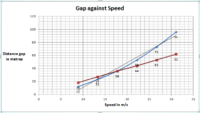
In the graph attached I have plotted distance in metres against speed in m/s. This is the blue line with plots on it. I was then asked to plot a time line which is shown in red. A question was then asked to find the distance in metres for a vehicle traveling at 25 m/s. This is easy but I wanted to use Excel software to plot it but I don't think Excel is able to plot vertical or horizontal lines?
Would anyone have any experience using Excel and advise me if this is possible please?
Now another question after trying to upload the graph, the maths forum software does not allow the Excel extension to be uploaded, anything I can do?

I've done a copy and paste.
In the graph attached I have plotted distance in metres against speed in m/s. This is the blue line with plots on it. I was then asked to plot a time line which is shown in red. A question was then asked to find the distance in metres for a vehicle traveling at 25 m/s. This is easy but I wanted to use Excel software to plot it but I don't think Excel is able to plot vertical or horizontal lines?
Would anyone have any experience using Excel and advise me if this is possible please?
Now another question after trying to upload the graph, the maths forum software does not allow the Excel extension to be uploaded, anything I can do?
I've done a copy and paste.