Graph / Trend Line Questions

Mjtruitt

New member
Joined
Jan 31, 2020
Messages
1
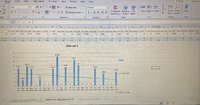
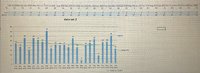
I have two sets of data graphed in excel. Numerators and denominators shown, and the percentage is graphed, over a 24 month graph.

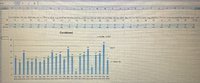
With data set 1, the linear trend line slopes negative. For data set 2, the trend also slopes negative. When I combine the data (the third, “combined” graph), the trend line suddenly slopes positive. Why is this?

You can check my math, the third graph is, in fact, a combination of the first two, no errors. Thanks so much for any help, it is really appreciated!
 

Attachments

  • 10320588-FC90-46F8-9339-89470C9996B2.jpeg
    10320588-FC90-46F8-9339-89470C9996B2.jpeg
    4 MB · Views: 3
  • E983F675-21A8-4C48-9020-5A28A604CC38.jpeg
    E983F675-21A8-4C48-9020-5A28A604CC38.jpeg
    3.1 MB · Views: 3
  • EDD6871E-657B-42F7-AACC-73664FAB680E.jpeg
    EDD6871E-657B-42F7-AACC-73664FAB680E.jpeg
    2.5 MB · Views: 3
Here is the reason: a straight line is not really a good fit for the first data set. Just because it is possible numerically to fit a straight line to some data does not mean that a straight line is a helpful description. Look at how many data points are far away from the "line of best fit." In the second data set, the straight line looks considerably more reasonable. But in both cases, the slope is only slightly negative even though the slope of the first data set is dragged downward by the zero values. When you combine the two sets of data, some of the months with zero suddenly become positive, which raises the slope. So the combined data have a slight upward slope.

A more sophisticated answer (that means much the same thing) is that the slopes are not statistically reliable. What you have is a virtually flat line with large deviations.
 
Top