You are using an out of date browser. It may not display this or other websites correctly.
You should upgrade or use an alternative browser.
You should upgrade or use an alternative browser.
How to find range if the domain is greater than zero?
- Thread starter orin
- Start date

Dr.Peterson
Elite Member
- Joined
- Nov 12, 2017
- Messages
- 16,965
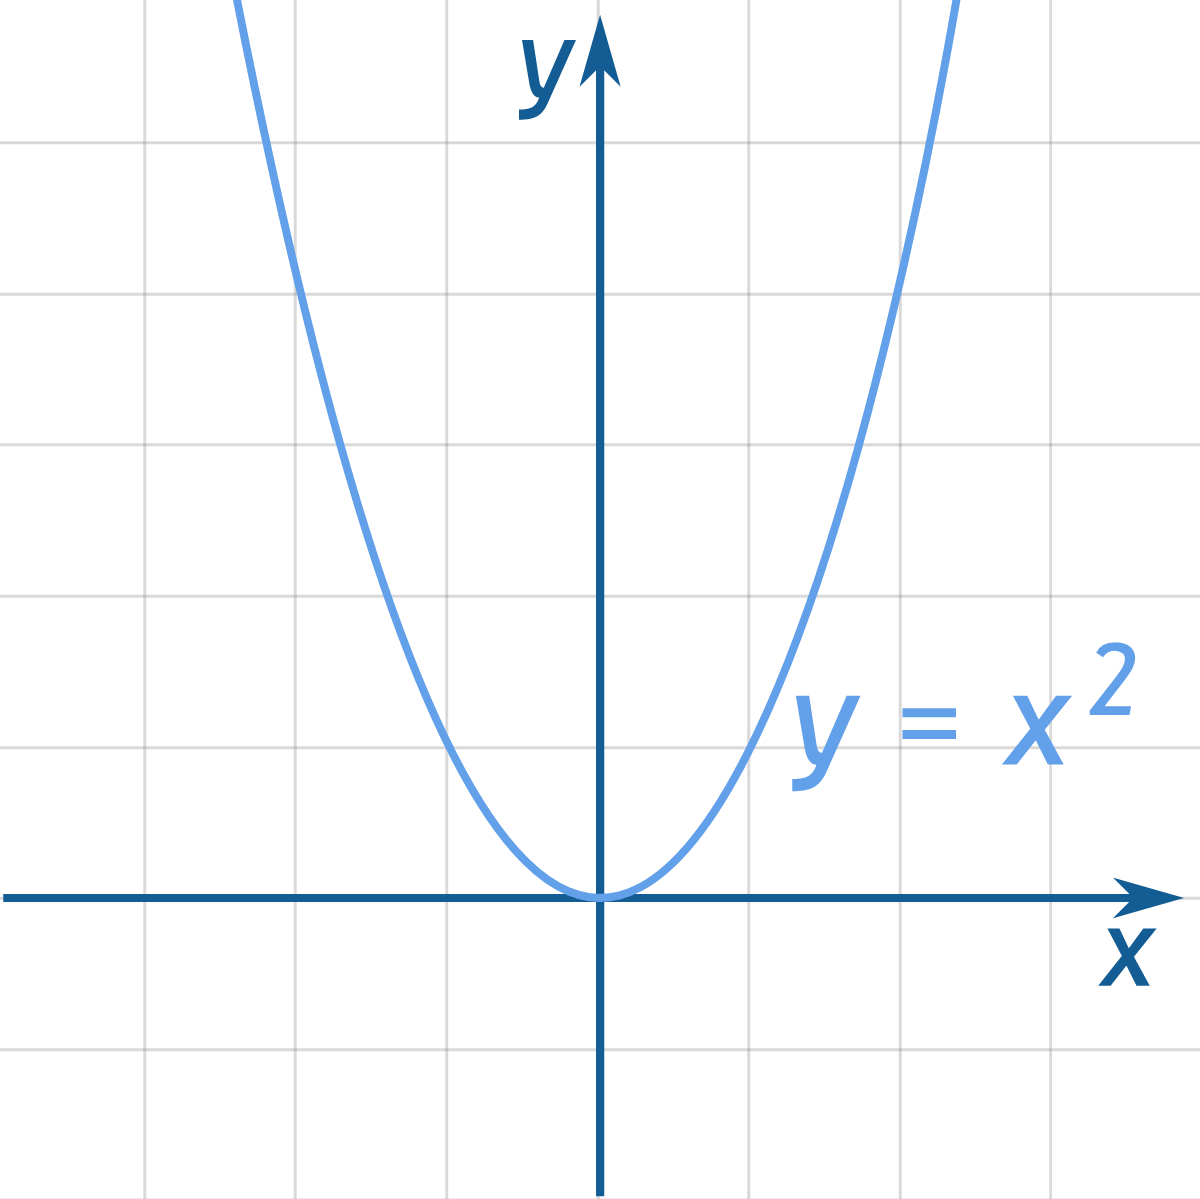
If you need to, sketch a graph of y = x^2 - 12, drawing only the part to the right of (or on) the y-axis.
What values of y are present on your graph? That is the range.
What values of y are present on your graph? That is the range.
How am I going to draw the graph of that equation? Can you go into detail?If you need to, sketch a graph of y = x^2 - 12, drawing only the part to the right of (or on) the y-axis.
What values of y are present on your graph? That is the range.
Dr.Peterson
Elite Member
- Joined
- Nov 12, 2017
- Messages
- 16,965
Presumably you have learned some method of graphing. You could plot a few points (e.g. x=0,1,2,3,4), or use facts you've learned about quadratic functions or parabolas, or facts about function transformations (horizontal or vertical shifts), or whatever. I have no idea what you have learned, so I can't give specific advice. But given the sophistication of the problem's notation, I would expect you to be able to do all of the above.
Let us know where you have trouble graphing it, and we can offer help.
Let us know where you have trouble graphing it, and we can offer help.
D
Deleted member 4993
Guest
You do see that the graph of y will be parabola - right! The parabola will open up..... and continue....How am I going to draw the graph of that equation? Can you go into detail?
Well, I have the basic education of an IGCSE high schooler (I'm giving O'level next year) , and because of the virus my education is going nowhere so i thought i might as well study on my own.Presumably you have learned some method of graphing. You could plot a few points (e.g. x=0,1,2,3,4), or use facts you've learned about quadratic functions or parabolas, or facts about function transformations (horizontal or vertical shifts), or whatever. I have no idea what you have learned, so I can't give specific advice. But given the sophistication of the problem's notation, I would expect you to be able to do all of the above.
Let us know where you have trouble graphing it, and we can offer help.
Dr.Peterson
Elite Member
- Joined
- Nov 12, 2017
- Messages
- 16,965
So, what have you studied? What can we assume you know, in order to help? What is the context of the problem you're asking about? Is it part of something you are studying, or something that might be well ahead of what you have learned?
Here are lessons on graphing parabolas and on transformations of functions:

 www.purplemath.com
 www.purplemath.com
Those should give you the background you need (possibly apart from some notation) if you lack it. (I'm assuming you know what range means.)
Here are lessons on graphing parabolas and on transformations of functions:
Graphing Quadratic Equations
A quadratic equation in Standard Form: (a, b, and c can have any value, except that a can't be 0.). Here's an example:
www.mathsisfun.com
How do you graph quadratic functions / parabolas?
To make your graph, start by picking points for your T-chart. Make sure that you have points on either side of where the parabola changes direction.
www.purplemath.com
Function Transformations
Let's start with a function, in this case it is f(x) = x2, but it could be anything: f(x) = x2. Here are some simple things we can do to move or...
www.mathsisfun.com
Function transformation/translation/trans-- what?
Function translation takes a function (and its graph) and, by adding and subtracting, moves the graph around the plane without changing its shape.
www.purplemath.com
Those should give you the background you need (possibly apart from some notation) if you lack it. (I'm assuming you know what range means.)