cleocj1000
New member
- Joined
- Nov 11, 2019
- Messages
- 5

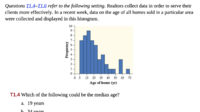
I understand how to estimate the median from the graph, but my answer choice was c) 24 which the textbook states is an incorrect answer, as they chose answer b) 34, so I would like to know if my calculations for the mean were wrong. I solved this by adding all the frequency values which is 52, dividing by 2 and then finding the interval where the 26th value would lie which is between 20-24.First, for a question like this ("which of the following ...)", the choices given are an essential part of the problem, so you have to include them all. There may be several possible answers, with only one of them in the list.
Now, do you know what median means? It is a number such that equal numbers of data points are above and below it. So you can add up the frequencies of all the classes, and then count up until the cumulative frequency is half of that. Then you'll have to do a little thinking.
I would start by turning the histogram into a table of values:
5-10: 710-15: 8...
Thanks. This is what you should have told us from the start! so often the real issue is an error in the book's answer, but we don't learn that until we've wasted time explaining what the asker already knew ...I understand how to estimate the median from the graph, but my answer choice was c) 24 which the textbook states is an incorrect answer, as they chose answer b) 34, so I would like to know if my calculations for the mean (?) were wrong. I solved this by adding all the frequency values which is 52, dividing by 2 and then finding the interval where the 26th value would lie which is between 20-24.
I apologize for the cropped answers, but the answer choices are
a. 19years
b. 34years
c. 24years
d. 39years
e. 29years