You are using an out of date browser. It may not display this or other websites correctly.
You should upgrade or use an alternative browser.
You should upgrade or use an alternative browser.
I have a question on DE but its really the graph that puzzles me.
- Thread starter Sonal7
- Start date
D
Deleted member 4993
Guest
Did you solve the DE? What is the solution?
In the graph:
which variable is plotted on the horizontal axis?
which variable is plotted on the vertical axis?
HallsofIvy
Elite Member
- Joined
- Jan 27, 2012
- Messages
- 7,760
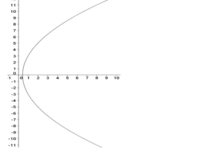
From \(\displaystyle \frac{dx}{dt}= \frac{8}{x}\), we can immediately get \(\displaystyle xdx= 8dt\). What do you get when you integrate both sides of that? Do you understand that \(\displaystyle \int xdx=\frac{1}{2}x^2+ C\)? Do you know what the graph of a quadratic looks like?
HallsofIvy
Elite Member
- Joined
- Jan 27, 2012
- Messages
- 7,760
Why does it not make sense? You know that the graph of a quadratic, y= ax^2, is a parabola, do you not? Here, since x is a function of t and it is t that is squared, the axis of symmetry is along the x-axis. You would probably have recognized it if you had chosen the horizontal axis to be t, the independent variable, and the vertical axis to be x, the dependent variable.