Hi everyone, I am new to differential equations
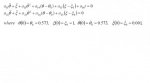
I have two second order differential equations with boundary conditions as shown in the attached figure. The author has generated a graph between Ɵ and t as a result of solving these equations. I need clarifications on how the author got the graph with the two differential equations. Thanks in advance

I have two second order differential equations with boundary conditions as shown in the attached figure. The author has generated a graph between Ɵ and t as a result of solving these equations. I need clarifications on how the author got the graph with the two differential equations. Thanks in advance