Hi I have a question I am stuck on
My graph is domain -10 < x <10 and range -10 < y < 10
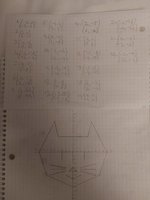
I have been given a list of y=mx+b equations and have to plot the lines to make up a picture(which I understand how to find the slope and the y intercept) and how to plot the points of the line
but under each equation its giving me a range like this which I am not sure what to do with i.e.:
y=-4x-12
-5 ≤ x ≤-4
or
x=-3
-2 ≤ y ≤ 0
My graph is domain -10 < x <10 and range -10 < y < 10
I have been given a list of y=mx+b equations and have to plot the lines to make up a picture(which I understand how to find the slope and the y intercept) and how to plot the points of the line
but under each equation its giving me a range like this which I am not sure what to do with i.e.:
y=-4x-12
-5 ≤ x ≤-4
or
x=-3
-2 ≤ y ≤ 0