Dont know what section to post in but I picked here and need a few questions answered at the end. I think I have most the work done especially the graphing bit. Anyway here we go
5) A car company builds two types of vehicles: cars and trucks. The most vehicles that can be built every day is 20. In order to stay in business the company needs to sell at least 5 cars and at least 5 trucks per day.
The profit on each car sold is €6,000, and on each truck sold is €8,000.
What number of cars and what number of trucks should the company build in order to maximise profits?
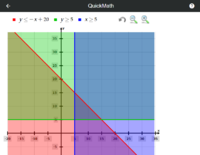
Answered on my part by plotting out on a graph and you will this attached.
(c) Calculate the coordinates of the points that are at the corners (i.e. the vertices) of the ‘feasible region’ for this problem?
^^^^^this is believe is what I have graphed out. correct me if that is wrong. if the graph is correct what is the points of the feasible region.
(d) Graph the constraint inequalities, and on the graph shade in the feasible region.
^^^^^^ on my graph. they are : x + y <=20. y>=5. and x>=5
(e) What number of cars and what number of trucks should be sold in order to maximise profits?
^^^once the graph and feasibility area is answered this should take care of itself
(f) What is the maximum profit that can be made?
^^^^same here
5) A car company builds two types of vehicles: cars and trucks. The most vehicles that can be built every day is 20. In order to stay in business the company needs to sell at least 5 cars and at least 5 trucks per day.
The profit on each car sold is €6,000, and on each truck sold is €8,000.
What number of cars and what number of trucks should the company build in order to maximise profits?
Answered on my part by plotting out on a graph and you will this attached.
(c) Calculate the coordinates of the points that are at the corners (i.e. the vertices) of the ‘feasible region’ for this problem?
^^^^^this is believe is what I have graphed out. correct me if that is wrong. if the graph is correct what is the points of the feasible region.
(d) Graph the constraint inequalities, and on the graph shade in the feasible region.
^^^^^^ on my graph. they are : x + y <=20. y>=5. and x>=5
(e) What number of cars and what number of trucks should be sold in order to maximise profits?
^^^once the graph and feasibility area is answered this should take care of itself
(f) What is the maximum profit that can be made?
^^^^same here