innanetaholic08
New member
- Joined
- Jan 1, 2007
- Messages
- 5
The above is my assignment.
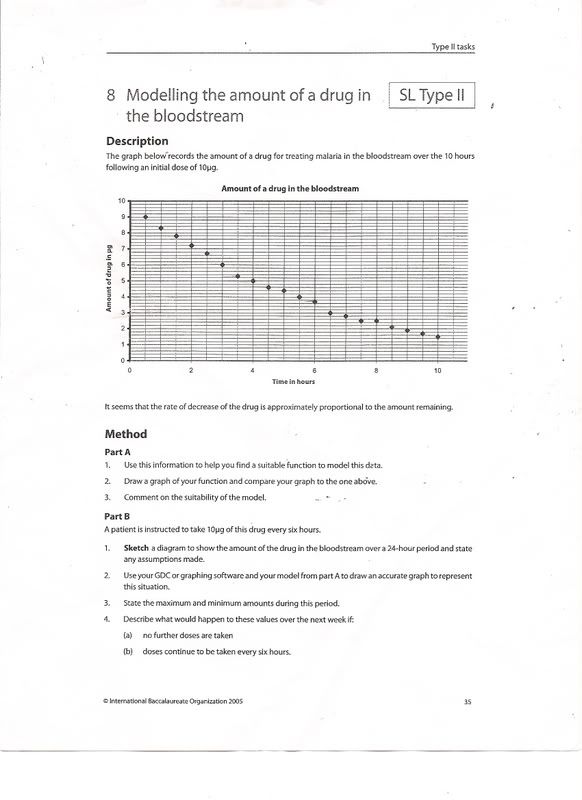
Description
The graph below records the amount of a drug for treating malaria in the bloodstream over the 10 hours following the initial dose of 10ug.
*Graph... check link*
It seems that the rate of decrease of the drug is approximately proportional to the amount remaining.
Method
Part A
1. Use this information to help you find a suitable function to model this data.
2. Draw a graph of your function and compare your graph to the one above.
3. Comment on the suitability of your model.
Part B
A patient is instructed to take 10 ug of this drug every six hours.
1. Sketch a diagram to show the amount of the druf in the bloodstream over a 24-hour period and state any assumptions made.
2. Use your GDC or graphing software and your model from Part A to draw an accurate graph to represent this situation.
3. State the maximum and minimum amounts during the period.
4. Describe what would happen to these values over the next week if:
(a) no further doses are taken
(b) doses continue to be taken every six hours.
Part A
So, I put the points into a plot on my calculator and ran the line of best fit and I found one that I like that fits the graph, its a number to the X power, so I'm not sure if that's right, but it fits rather nicely. So I guess it answers all three questions. It's a suitable function, and I can compare it to the graph given, and it fits the graph really nicely, so I think I am on the right track.
Part B
1. I think this is where I draw what is given, then at hour six I add 10 ug to the amount that is alread on the graph and continue it that way until hour 12 where I spike it back up with another 10ug and continue on this way for the total 24-hours.
2. I have no idea how to do number 2 or what it is asking, I think I'm supposed to find an actual graph to graph what I did in number one, but I have this feeling that that is wrong.
3. The maximum would be 10 ug plus the amount it is at 6 and the minumum would be the amount at 5 and a half hours... I think.
4. (a) I would say that the amounts would slowly decrease until the graph reaches a limit at zero.
(b) The graph would spike up at 6-hour intervals as it was over the 24-hour period.
So, am I on the right track, or completely lost in the woods. I would really appreciate any guidance or help anyone has to offer about this question. Thanks again.