Need help pls

This is a multiple choice problem, so you can simply try each of the choices. Since the points lie almost on a straight line just checking the values at the first and the last points seems enough to figure out which one is the best choice.
 
This is a multiple choice problem, so you can simply try each of the choices. Since the points lie almost on a straight line just checking the values at the first and the last points seems enough to figure out which one is the best choice.
Or you could calculate the sum of the squared errors for each option, and choose the equation with the least sum of squares.
 
Or you could calculate the sum of the squared errors for each option, and choose the equation with the least sum of squares.
It is not clear to me what are the exact values in the graph. It is true that small errors in those values would not effect the (multiple choice) answer, but still...
 
It is not clear to me what are the exact values in the graph. It is true that small errors in those values would not effect the (multiple choice) answer, but still...
You are correct. Stupid problems invite stupid answers
 
Last edited:
whats the answer?


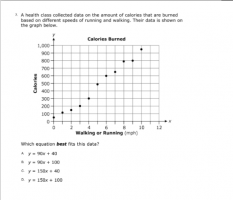
You need to show some work here. Look at the extreme points, which look
to be (0, 50) and (10, 950), when rounded to the nearest tens.

Work out the slope of a hypothetical line between these points.

This hypothetical line divides the points, where more of them are below the
line than are above it. None of the answer choices include 50 as a vertical
intercept. However, consider if a "better line of best fit" is achieved by
moving down the hypothetical line a smaller increment. Then it can have
about the same number of data points on either side of it. That would
decrease the vertical intercept by a proportional amount.
 
Last edited:
Hi anteater. For this exercise, I like Dr. Peterson's suggestion to graph the lines. Two of the lines are way off. The remaining two lines lie mostly above the points, and that fact makes the answer obvious.

:)
 
Top