You are using an out of date browser. It may not display this or other websites correctly.
You should upgrade or use an alternative browser.
You should upgrade or use an alternative browser.
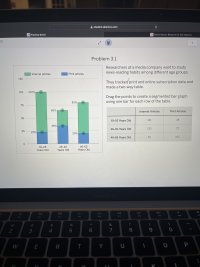
Not sure how to do this problem: "Researchers at a media company want to study news-reading habits among different age groups."
- Thread starter lu346
- Start date
Dr.Peterson
Elite Member
- Joined
- Nov 12, 2017
- Messages
- 16,958
How would I do this problem, I tried it but it was wrong.

How did you choose your percentages?
To me, the problem is unclear. What are you to find percentages with respect to? Do the numbers represent, say, the number of people in a given age range who subscribe to each kind of article? Does no one subscribe to both? Are you to ignore those who subscribe to neither?
Possibly something in your class implied some assumptions you are expected to make.
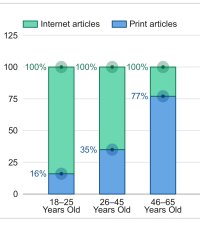
But the best I can see, given the incomplete data, is to find each number as a percentage of the total in its row, and then make the bar graph according to what you learned a "segmented bar graph" is supposed to be. (If I'm right, then the top of each would be at 100%.)
Dr.Peterson
Elite Member
- Joined
- Nov 12, 2017
- Messages
- 16,958
Yes, that is probably what is intended.Oh ok this make sense, I think I’ve figured it out now. I put the top of each at 100 percent and then calculated the percentages. I included an attached image of my completed problem. Thank you so much for your help!