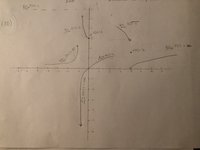
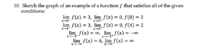
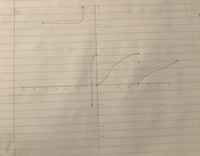
Hi there, I feel like I have no idea what im doing when I comes to sketching graphs using limits. Im fine with evaluating limits from graphs but not the other way around. In the attached files I show the graph I made but I think it is wrong. Can anyone show me how to make a proper graph that satisfies limits? Can one part of the function satisfy two conditions?
Thank you, I appreciate the help!
Thank you, I appreciate the help!