Question about Proportions

epshiple

New member
Joined
May 6, 2022
Messages
4
I will try my best to explain this, as I can't seem to be able to upload the spreadsheet that I am working from.

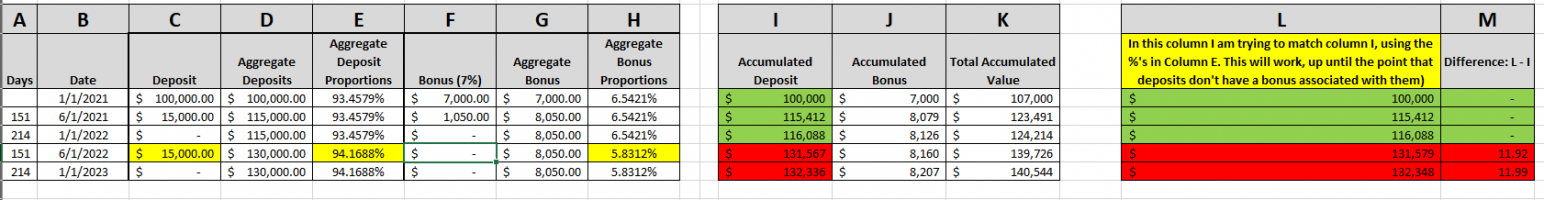
I am trying to get the formula in Column L to calculate the value in Column I, using the value in Column K. The most important thing to note is, I need to be able to calculate the value shown in column I, using only the value in column K. How I go about doing this, is flexible.

Column "L" contains the formula: "E" x "K"
  • Each deposit in the first year, gets an additional 7% bonus. After the first year, there is no bonus for any additional deposits.
  • Columns I:J are accumulating at a rate of 1%, so the deposit and bonus are growing at the same rate.
  • Column E's formula is simply: "D" / ("D"+"G")
    • Column H is the same, just re-arranged.
  • The yellow highlight in the 4th row of the table is where my logic breaks down, because it is the first deposit made that does not have a corresponding bonus. You can see that after this deposit is made in year 2, Column M shows the difference between the value I am calculating and the value I am trying to match to.
Anyone have an idea what I am missing?
 

Attachments

  • Capture.PNG
    Capture.PNG
    32.4 KB · Views: 15
First question:
Can you explain how are they accumulating 1% in I and J? It went from 100,000 ->115,412.

Also, please share your formula in L.
 
Last edited:
Why in the world do you assume that a proportion will give you the answer that you want? Three things are going on, deposits, bonuses, and interest, and you seem to want to determine the result of all three by focusing on just one. It makes no sense.

It is very hard to help you because the only clue we have is a bunch of formulas that do not lead to the result you want. Why don’t you tell us what you want to know?
That’s why I posted the question in the first place. I didn’t know if what I was asking was possible. The first three rows in column L work out, but it’s just because the bonus and deposits remain in the same proportions, and are growing at the same interest rate. But in the 4th row a deposit is made with no corresponding bonus, which changes the proportions. I was hoping to get an answer to whether or not it’s possible to adjust the proportions in such a way that column L continues to match column I.
 
If what you want to do is to explain the total, there MAY BE some complex formula to show the proportion of the aggregate due to the bonus while disregarding the effect of interest, but it would surely not be easy to explain. Nor would it explain the aggregate because interest does affect the aggregate.

In presentation, simplicity is best.

Column A: Starting Date
Column B: Ending Date
Column C: Starting Balance
Column D: Deposits
Column E: Bonus
Column F: Interest Earned
Column G: Ending Balance

Now if you think it meaningful, you could sum columns D, E, and F and then take a percentage of each total relative to the final ending balance. That is a very simple way to explain exactly how you get to the ending balance and show the accumulated relative effect of the three drivers of that ending balance.

I had what most people would consider a very successful business career. Part of my success is attributable to my having always taken pains to make presentations as simple as the complexity of the situation allowed.
 
Last edited:
If what you want to do is to explain the total, there MAY BE some complex formula to show the proportion of the aggregate due to the bonus while disregarding the effect of interest, but it would surely not be easy to explain. Nor would it explain the aggregate because interest does affect the aggregate.

In presentation, simplicity is best.

Column A: Starting Date
Column B: Ending Date
Column C: Starting Balance
Column D: Deposits
Column E: Bonus
Column F: Interest Earned
Column G: Ending Balance

Now if you think it meaningful, you could sum columns D, E, and F and then take a percentage of each total relative to the final ending balance. That is a very simple way to explain exactly how you get to the ending balance and show the accumulated relative effect of the three drivers of that ending balance.

I had what most people would consider a very successful business career. Part of my success is attributable to my having always taken pains to make presentations as simple as the complexity of the situation allowed.
I appreciate the comments. I do wish I could have attached the spreadsheet to the post itself, just because it can sometimes be difficult to convey what is going on in a picture, as well as covering all background information. I will make sure to put a bit more effort into the process next time.

Regarding this question, I went ahead and just built out the columns "Accumulated Premium" and "Accumulated Bonus" in my workbook as a way to solve what I was trying to achieve. So I no longer have an issue. Thanks for your efforts!
 
Top