Scatterplots

James Smithson

New member
Joined
Nov 6, 2020
Messages
45
Im new to these and I think i have the right answers for my questions but wanted to make sure i do :)


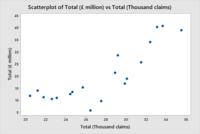
1. is it positive or negative or non?
The relationship is positive as both variables increase.

2. Is it linear or not?
It is linear as a straight line represents the data well

3. is it strong or weak
It is fairly strong however it is not a oerfect relationship

4. are there any outliers?
yes there may be a potential outlier at (26.5, 7.5)


I feel like im on the right lines, im not sure how to elaberate my points yet but just wanted to know im not messing up and I have got the right idea

thank you in advance
 

Attachments

  • Scatterplot of Total (£ million) vs Total (Thousand claims).png
    Scatterplot of Total (£ million) vs Total (Thousand claims).png
    8.5 KB · Views: 7
These are somewhat subjective, unless you were given some specific rules to go by. That's why I haven't answered yet -- I'm hoping someone else is more sure than I am.

But I would say it's not really very linear, and not all that strongly correlated; it looks to me more like a mix of two data sets, one linear and one non-linear. And your outlier is not far enough from others to drop, unless you have already decided what the overall shape is.

Don't take my word for it, though; I'm not a statistician and don't have much experience comparing such judgments with others.
 
I agree with Dr P and delayed replying for the same reason. Here's my thoughts:
It's generally a positive correlation except at the extreme ends of the data.
I don't think it is linear - there is a definite curved shape to the data.
There's a reasonably strong relationship (but not linear).
Outliers depend on what type of function you use to model the data.
 
yeh im really unsure about this work hoping I am getting it right but there is nothing to go off i presume becasuse it is subject it just wants my oppinion.

I appreciate the messages
 
It is in my opinion a truly stupid question. As has been indicated, any answer is subjective until you start testing alternatives.

You can always fit a line to data. I’d guess that a line fitted to this data will have a positive slope. But that is just a guess. I’d also guess that the residual error will be high. That too is a guess. I’d also guess that error terms will not look independent. The only way to confirm those guesses is to fit the line, look at the residual error, and plot the error terms.

If you decide that a linear model does not fit well, then you think about alternative models.
 
Top