You are using an out of date browser. It may not display this or other websites correctly.
You should upgrade or use an alternative browser.
You should upgrade or use an alternative browser.
The Central Limit Theorem
- Thread starter eutas1
- Start date
")
Harry_the_cat
Elite Member
- Joined
- Mar 16, 2016
- Messages
- 3,779
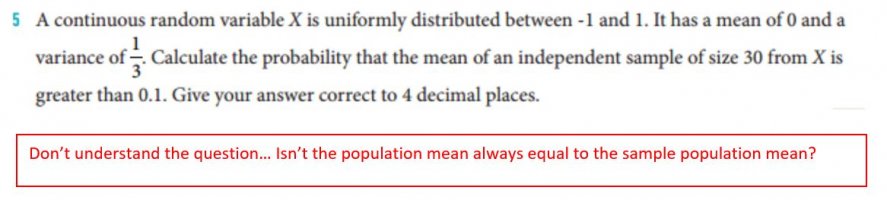
If you have a population and take sufficiently large random samples, with replacement, the distribution of the sample means will be approximately normally distributed.
This is true regardless of how the source population is distributed, provided the sample size is large enough (typically n≥30).
If X is distributed with a mean of \(\displaystyle \mu\) and a variance of \(\displaystyle \sigma^2\), then (as long as n≥30), the sample mean is distributed approximately normal with a mean of \(\displaystyle \mu\) and a variance of \(\displaystyle \frac{\sigma^2}{n}\).
Can you see how to proceed with the question?
In answer to your other question. No the population mean and the sample mean are not the same. Imagine if you have a population of 1000 people and their mean height is 165cm. That is the population mean. If you take a sample of, say, 30 people from that population and find the mean height of those 30 people (ie the sample mean) it probably won't be exactly 165cm. If you take another sample of 30, and find the mean height of them (ie another sample mean) it will probably be different again. If you do this enough times and keep a list of all the sample means and find the mean of the sample means, it will be approximately 165cm. That is basically what the central limit theorem is all about.
Hope that helps your understanding.
Last edited:
If you have a population and take sufficiently large random samples, with replacement, the distribution of the sample means will be approximately normally distributed.
This is true regardless of how the source population is distributed, provided the sample size is large enough (typically n≥30).
If X is distributed with a mean of \(\displaystyle \mu\) and a variance of \(\displaystyle \sigma^2\), then (as long as n≥30), the sample mean is distributed approximately normal with a mean of \(\displaystyle \mu\) and a variance of \(\displaystyle \frac{\sigma^2}{n}\).
Can you see how to proceed with the question?
In answer to your other question. No the population mean and the sample mean are not the same. Imagine if you have a population of 1000 people and their mean height is 165cm. That is the population mean. If you take a sample of, say, 30 people from that population and find the mean height of those 30 people (ie the sample mean) it probably won't be exactly 165cm. If you take another sample of 30, and find the mean height of them (ie another sample mean) it will probably be different again. If you do this enough times and keep a list of all the sample means and find the mean of the sample means, it will be approximately 165cm. That is basically what the central limit theorem is all about.
Hope that helps your understanding.
But in the question, the sample size is 30... which means the sample mean will be the same as the population mean. So why are we calculating the probability of the sample MEAN being greater than 0.1? Isn't it 0?
Also, in the worked solution, they just use the normal cdf function on the graphics calculator to get the answer - but why is the x-value suddenly the mean? Is it because the X value can be anything - and this case, they made it the mean?? but then that would mean that there is a mean within the mean probability distribution, which doesn't make sense...
Last edited:
Wait I think I am misunderstanding the whole concept. The central limit theorem is in the context of the population and the sample population. So the X values for the sample population probability IS the mean?? Is this right?But in the question, the sample size is 30... which means the sample mean will be the same as the population mean. So why are we calculating the probability of the sample MEAN being greater than 0.1? Isn't it 0?
Also, in the worked solution, they just use the normal cdf function on the graphics calculator to get the answer - but why is the x-value suddenly the mean? Is it because the X value can be anything - and this case, they made it the mean?? but then that would mean that there is a mean within the mean probability distribution, which doesn't make sense...
This is why for population, the symbols are μ and Σ and for sample population it's μx̄ and Σx̄ ?? And that's why all the questions are talking about the mean....??
Harry_the_cat
Elite Member
- Joined
- Mar 16, 2016
- Messages
- 3,779
Yes read the last bit of post #2 again.
Don't use the term "sample population". There is one population from which you can take many samples. From each of these samples, you can calculate a mean. This then gives you a new distribution of values, ie of sample means. You can then find the mean of this distribution. That is, the mean of the sample means. The mean of the sample means is symbolised "mu subscript X-bar".
If you take n random samples and n>=30, then the mean of the sample means will be approximately equal to the mean of the original Xs.
A bit confusing but I think I get it now, thank you!!Yes read the last bit of post #2 again.
Don't use the term "sample population". There is one population from which you can take many samples. From each of these samples, you can calculate a mean. This then gives you a new distribution of values, ie of sample means. You can then find the mean of this distribution. That is, the mean of the sample means. The mean of the sample means is symbolised "mu subscript X-bar".
If you take n random samples and n>=30, then the mean of the sample means will be approximately equal to the mean of the original Xs.