Yoyoma2732
New member
- Joined
- Sep 4, 2021
- Messages
- 8
Please help solve this problem.

What help do you need? What have you tried?Please help solve this problem.
View attachment 28760
What help do you need? What have you tried?
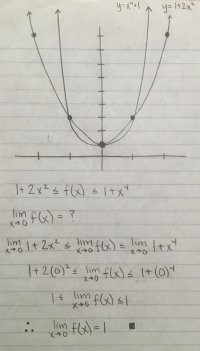
I'd look for a function that both [imath]1+2x^2[/imath] and [imath]1+x^4[/imath] are less than, for all x in (-1,1). (A function that they are both greater than is easy.)
None of your work is irrelevant. In a piecewise function, the two "pieces" can be utterly unrelated, and they never apply to the same value of x. So subtracting one formula from the other is meaningless.Thank you Dr. Peterson,
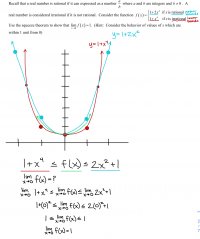
I had difficultly deciphering what “x is rational” and “x is irrational” meant and finding a place to start from there. From your advise, this is my attempt at the problem. Please let me know if my reasoning is flawed. Thank you for your help thus far.
Thank you for your help! Based upon what you said, this is what I came up with. Again, please let me know if I applied what you were trying to explain to me.None of your work is irrelevant. In a piecewise function, the two "pieces" can be utterly unrelated, and they never apply to the same value of x. So subtracting one formula from the other is meaningless.
Furthermore, your "bounds" are not on the function f, and the limit you state doesn't answer the question, which is about the limit of f.
It sounds like you don't understand how the function works. You might think about it by lightly graphing [imath]y = 1+2x^2[/imath] and [imath]y=1+x^4[/imath]. Then the idea of the function in principle is that for every rational number value of x, you would put a dot on the first curve, and for every other value of x you would put a dot on the second curve. Of course, both kinds of numbers are scattered densely along the number line, so there's no way to actually do that; the theoretical graph would look essentially like what you've drawn, just two lightly drawn curves!
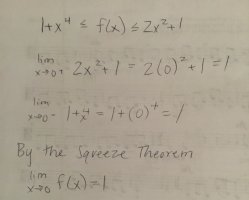
So you can tell from the graph that the limit is 1; and what you see is more or less the way to prove it. Which curve is higher, for x near zero? You can use that as an upper bound, since the value of f(x) is never greater than that. Which curve is lower? You can use that as a lower bound. Now the limit of f(x) is between the limits of those two functions! Give it a squeeze, and you have your proof!
Thank you for your help! Based upon what you said, this is what I came up with. Again, please let me know if I applied what you were trying to explain to me.
Your graph isn't quite right; they don't intersect at (-1,3) and (1,3). Also your inequality below that is wrong! Which graph is higher near 0?Thank you for your help! Based upon what you said, this is what I came up with. Again, please let me know if I applied what you were trying to explain to me.
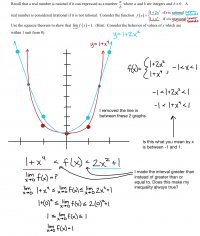
The inequality you stated isn't always true! At least restate their hint, that this is true when x is between -1 and 1. (It's really true on a somewhat larger interval, and ideally you would prove that.)What do you mean by state the condition of the inequality. Would that be 1+x^4 <1 and (2x^2)+1 > 1?
I wrote 1+x^4 <1 and (2x^2)+1 > 1 because I was confused about the interval. The attached photos show the changes that I made.