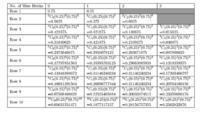
I have to find the probability of exactly 0, 1, 2 and 3 blue bricks being in the different rows. I've already done this and posted the image of the completed table of probabilities. My question is that, what are the different trends observed and provide detailed reasoning for the trend occurring. I've already identified most of the trends such as the probability of selecting exactly 0 blue bricks decreases as the number of trials (rows) increases. This is because as there are more trials, their more combinations that could occur, therefore the probability for exactly 0 blue bricks being their decreases. Now we can also see that for selecting exactly 1, and 2 blue bricks, the probability first increases then it decreases. I don't know why this occurs, I was thinking maybe its approaching expected value but I don't think that's correct. And for the last column, the probability increases as the number of trials (rows) increases. I'm guessing just like the second and the third column that after a certain number of trials that the probability will start to decreases. So again my question is why does this happen? And is my reasoning for the trend in the first column correct? And if you identify any more trends please let me know.
Thank you so much for taking the time out of your day to read this.
Thank you so much for taking the time out of your day to read this.