central tendency

Status
Not open for further replies.

eddy2017

Elite Member
Joined
Oct 27, 2017
Messages
2,525
hi,
find the mean, median and mode of the following data set and determine which measure (of central tendency is best to use in each set

I'm giving you only a set here( there are different sets)
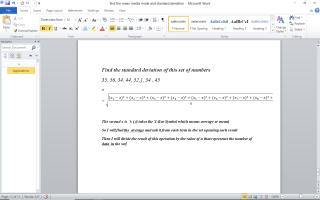
35, 56, 34, 44, 52,1, 34 , 45

i have no doubt at all about finding the central tendency of a given set of numbers. Piece of cake!
now, my problem is when determining which measure to use and when i have to show deviations to the left and to the right of the mean
in the case at hand, i am asked to represent the distribution on a normal distribution curve and show three standard deviations to the left and three standard deviations to the right.

the mean of this data set =37.6
median= 39.5
mode= 34

please, if you do not mind, let's tackle it one question at a time.
how do i make a judgement as to what measure is best to use?.
the problem asks me to choose the best measure to use with that set.

if you know of a tutorial that teaches the basic of how to do that distribution on a curve, please, let me know so i can get informed about this
 
Last edited:
  1. Mean is the most frequently used measure of central tendency and generally considered the best measure of it. However, there are some situations where either median or mode are preferred.
  2. Median is the preferred measure of central tendency when:
    1. There are a few extreme scores in the distribution of the data. (NOTE: Remember that a single outlier can have a great effect on the mean). b.
    2. There are some missing or undetermined values in your data. c.
    3. There is an open ended distribution (For example, if you have a data field which measures number of children and your options are 0, 1, 2, 3, 4, 5 or “6 or more,” than the “6 or more field” is open ended and makes calculating the mean impossible, since we do not know exact values for this field).
    4. You have data measured on an ordinal scale.
    5. Mode is the preferred measure when data are measured in a nominal ( and even sometimes ordinal) scale.
according to this info i found online then the best central tendency measure to use with this set would be 'median' cos there is an outlier, which is 1 and outliers can distort the overall measure big time.
i got this now.
here's my other question. i need help with this.

in the case at hand, i am asked to represent the distribution on a normal distribution curve and show three standard deviations to the left and three standard deviations to the right???
i know how to find the standard deviation of this set of numbers, i know how to do it, but what throws me is to represent it on a normal distribution curve three deviations to the left and three to the right, that i do not get.
should i go and find the standard deviation of the set and go from there?.
 
Last edited:
1627240786710.png
this is how i would find the standard deviation of this data set.
but what i do not understand is this:
'represent the distribution on a normal distribution curve and show three standard deviations to the left and three standard deviations to the right'.
 

Attachments

  • 1627240686939.png
    1627240686939.png
    152.1 KB · Views: 2
i have found some information on normal distribution. let me study it and i'll try to do it own my own if i can. give me some time. thanks
 
Ms Harriet, would you help with this exercise, please. I have a lot of info on normal distribution but do not know to apply to this exercise, not to any one for that matter.
Would you drop me a hint about what to focus on first?

I repeat the question
in the case at hand, i am asked to represent the distribution on a normal distribution curve and show three standard deviations to the left and three to the right.
Thanks
What are the characteristics of a Normal Distribution? How would you define it mathematically?

What is the equation for calculation of "standard deviation"?

ref: https://corporatefinanceinstitute.com/resources/knowledge/other/normal-distribution/
 
What are the characteristics of a Normal Distribution? How would you define it mathematically?

What is the equation for calculation of "standard deviation"?

ref: https://corporatefinanceinstitute.com/resources/knowledge/other/normal-distribution/
definition
The normal distribution is a probability function that describes how the values of a variable are distributed. It is a symmetric distribution where most of the observations cluster around the central peak and the probabilities for values further away from the mean taper off equally in both directions. Extreme values in both tails of the distribution are similarly unlikely.

equation for standard deviation
given at post #3
 
Dr Khan, i problem applying it. i do not know how to do it. there's lots of info out there and i have copied / studied information from videos, but application is what i need.
i have aplied the formula to find standard deviation right here in posts above
I know how to find it, but in t his exercise i need to represent the distribution on a distribution curve and find three deviations to the right and three to the left. ????
this is where i 'm stuck.
i thought i wrote the exercise wrong cos it's been posted since yesterday morning and no one has dropped a hint, which is unusual.
 
definition
The normal distribution is a probability function that describes how the values of a variable are distributed. It is a symmetric distribution where most of the observations cluster around the central peak and the probabilities for values further away from the mean taper off equally in both directions. Extreme values in both tails of the distribution are similarly unlikely.

equation for standard deviation
given at post #3
Instead of "xeroxing" the definition, you should first state it in "your own words".

equation for standard deviation
given at post #3
Great - did you calculate it?
 
Dr Khan, i problem applying it. i do not know how to do it. there's lots of info out there and i have copied / studied information from videos, but application is what i need.
i have aplied the formula to find standard deviation right here in posts above
I know how to find it, but in t his exercise i need to represent the distribution on a distribution curve and find three deviations to the right and three to the left. ????
this is where i 'm stuck.
i thought i wrote the exercise wrong cos it's been posted since yesterday morning and no one has dropped a hint, which is unusual.
So you have calculated µ (mean) and σ (std. deviation)

Now calculate µ ± 3*σ

What you do with µ ± 3*σ values?
 
normal distribution is a type of distribution. a type of distribution for a certain set of data. that is how i see it, in my own words. it is seen a lot in graphs.
 
okay, i finished calculating the standard deviation.
the mean was easy =37.6
the standard deviation =251.735 (applying the formula for standard deviation)
 
So you have calculated µ (mean) and σ (std. deviation)

Now calculate µ ± 3*σ

What you do with µ ± 3*σ values?

i should calculate mean + /- 3* standard deviation.
okay
mean + 3* standard deviation
=37.6 +3(251.735)
37.6+755.205 = 792.805
37.6 -755.205= -717.605
(I ASSUME THAT THE PLUS AND MINUS SIGN IS TELLING ME I SHOUD DO BOTH OPERATIONS).

You ask me what i do with these values. don't know. Maybe compare them and see how much of difference there is between the two and that tells me how sparsely or clustered together the data might be.don't really really know for sure. Just inferring from what I have read .
 
Last edited:
okay, i finished calculating the standard deviation.
the mean was easy =37.6
the standard deviation =251.735 (applying the formula for standard deviation)
That isn't the standard deviation. (The standard deviation cannot be any larger than the width of your data set!) You forgot to take the square root.

-Dan
 
i should calculate mean + /- 3* standard deviation.
okay
mean + 3* standard deviation
=37.6 +3(251.735)
37.6+755.205 = 792.805
37.6 -755.205= -717.605
(I ASSUME THAT THE PLUS AND MINUS SIGN IS TELLING ME I SHOUD DO BOTH OPERATIONS).

You ask me what i do with these values. don't know. Maybe compare them and see how much of difference there is between the two and that tells me how sparsely or clustered together the data might be.don't really really know for sure. Just inferring from what I have read .
Study:

 
Status
Not open for further replies.
Top