Hello,
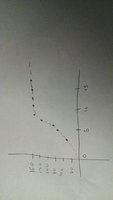
My first thread and wasnt quite sure were to put it. So I was given a graph that plots data within the (x,y) axis. And asked to see if I could figure out a equation/model that resembles it. I can see that theres a asymptote at y =160,and that the graph rises as if 2^x(exponential) and asymptotes at 160. Apologies for horrible drawing. But cant quite figure out how to solve this problem. Or what direction I should take.Any help is appreciated.
My first thread and wasnt quite sure were to put it. So I was given a graph that plots data within the (x,y) axis. And asked to see if I could figure out a equation/model that resembles it. I can see that theres a asymptote at y =160,and that the graph rises as if 2^x(exponential) and asymptotes at 160. Apologies for horrible drawing. But cant quite figure out how to solve this problem. Or what direction I should take.Any help is appreciated.