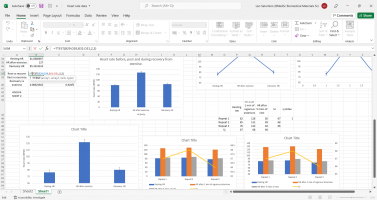
My apologies. I've reread what I wrote and knew why you've might misunderstand what I meant. What I meant was you can add a 4th category to the first graph. Essentially combine 1st and 3rd graph into one, so repeat 1, 2, 3, and averages. On the averages, you can add the error bars.
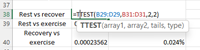
As far as the p-value, you can conduct a two-tailed
comparison of two population means. You can visually see that from your 3rd graph. If the error bars overlap then there's no significant difference (Resting vs. Recovery), whereas when the error bars do not overlap then there's a significant difference (Resting vs Excercise and Excercise vs.Recovery)